Case Study · Virginia (PJM)
Dominion Virginia: Data Centers Drive the Grid Buildout, Households Are Billed Its Largest Share
Bills rose 34 to 38% across every customer class since 2022, led so far by clean-energy mandates, the local grid, and fuel. Data centers drive what gets built next, and because their load is steady rather than peaky, the decades-old rules that bill by peak put the largest share of that buildout on households.
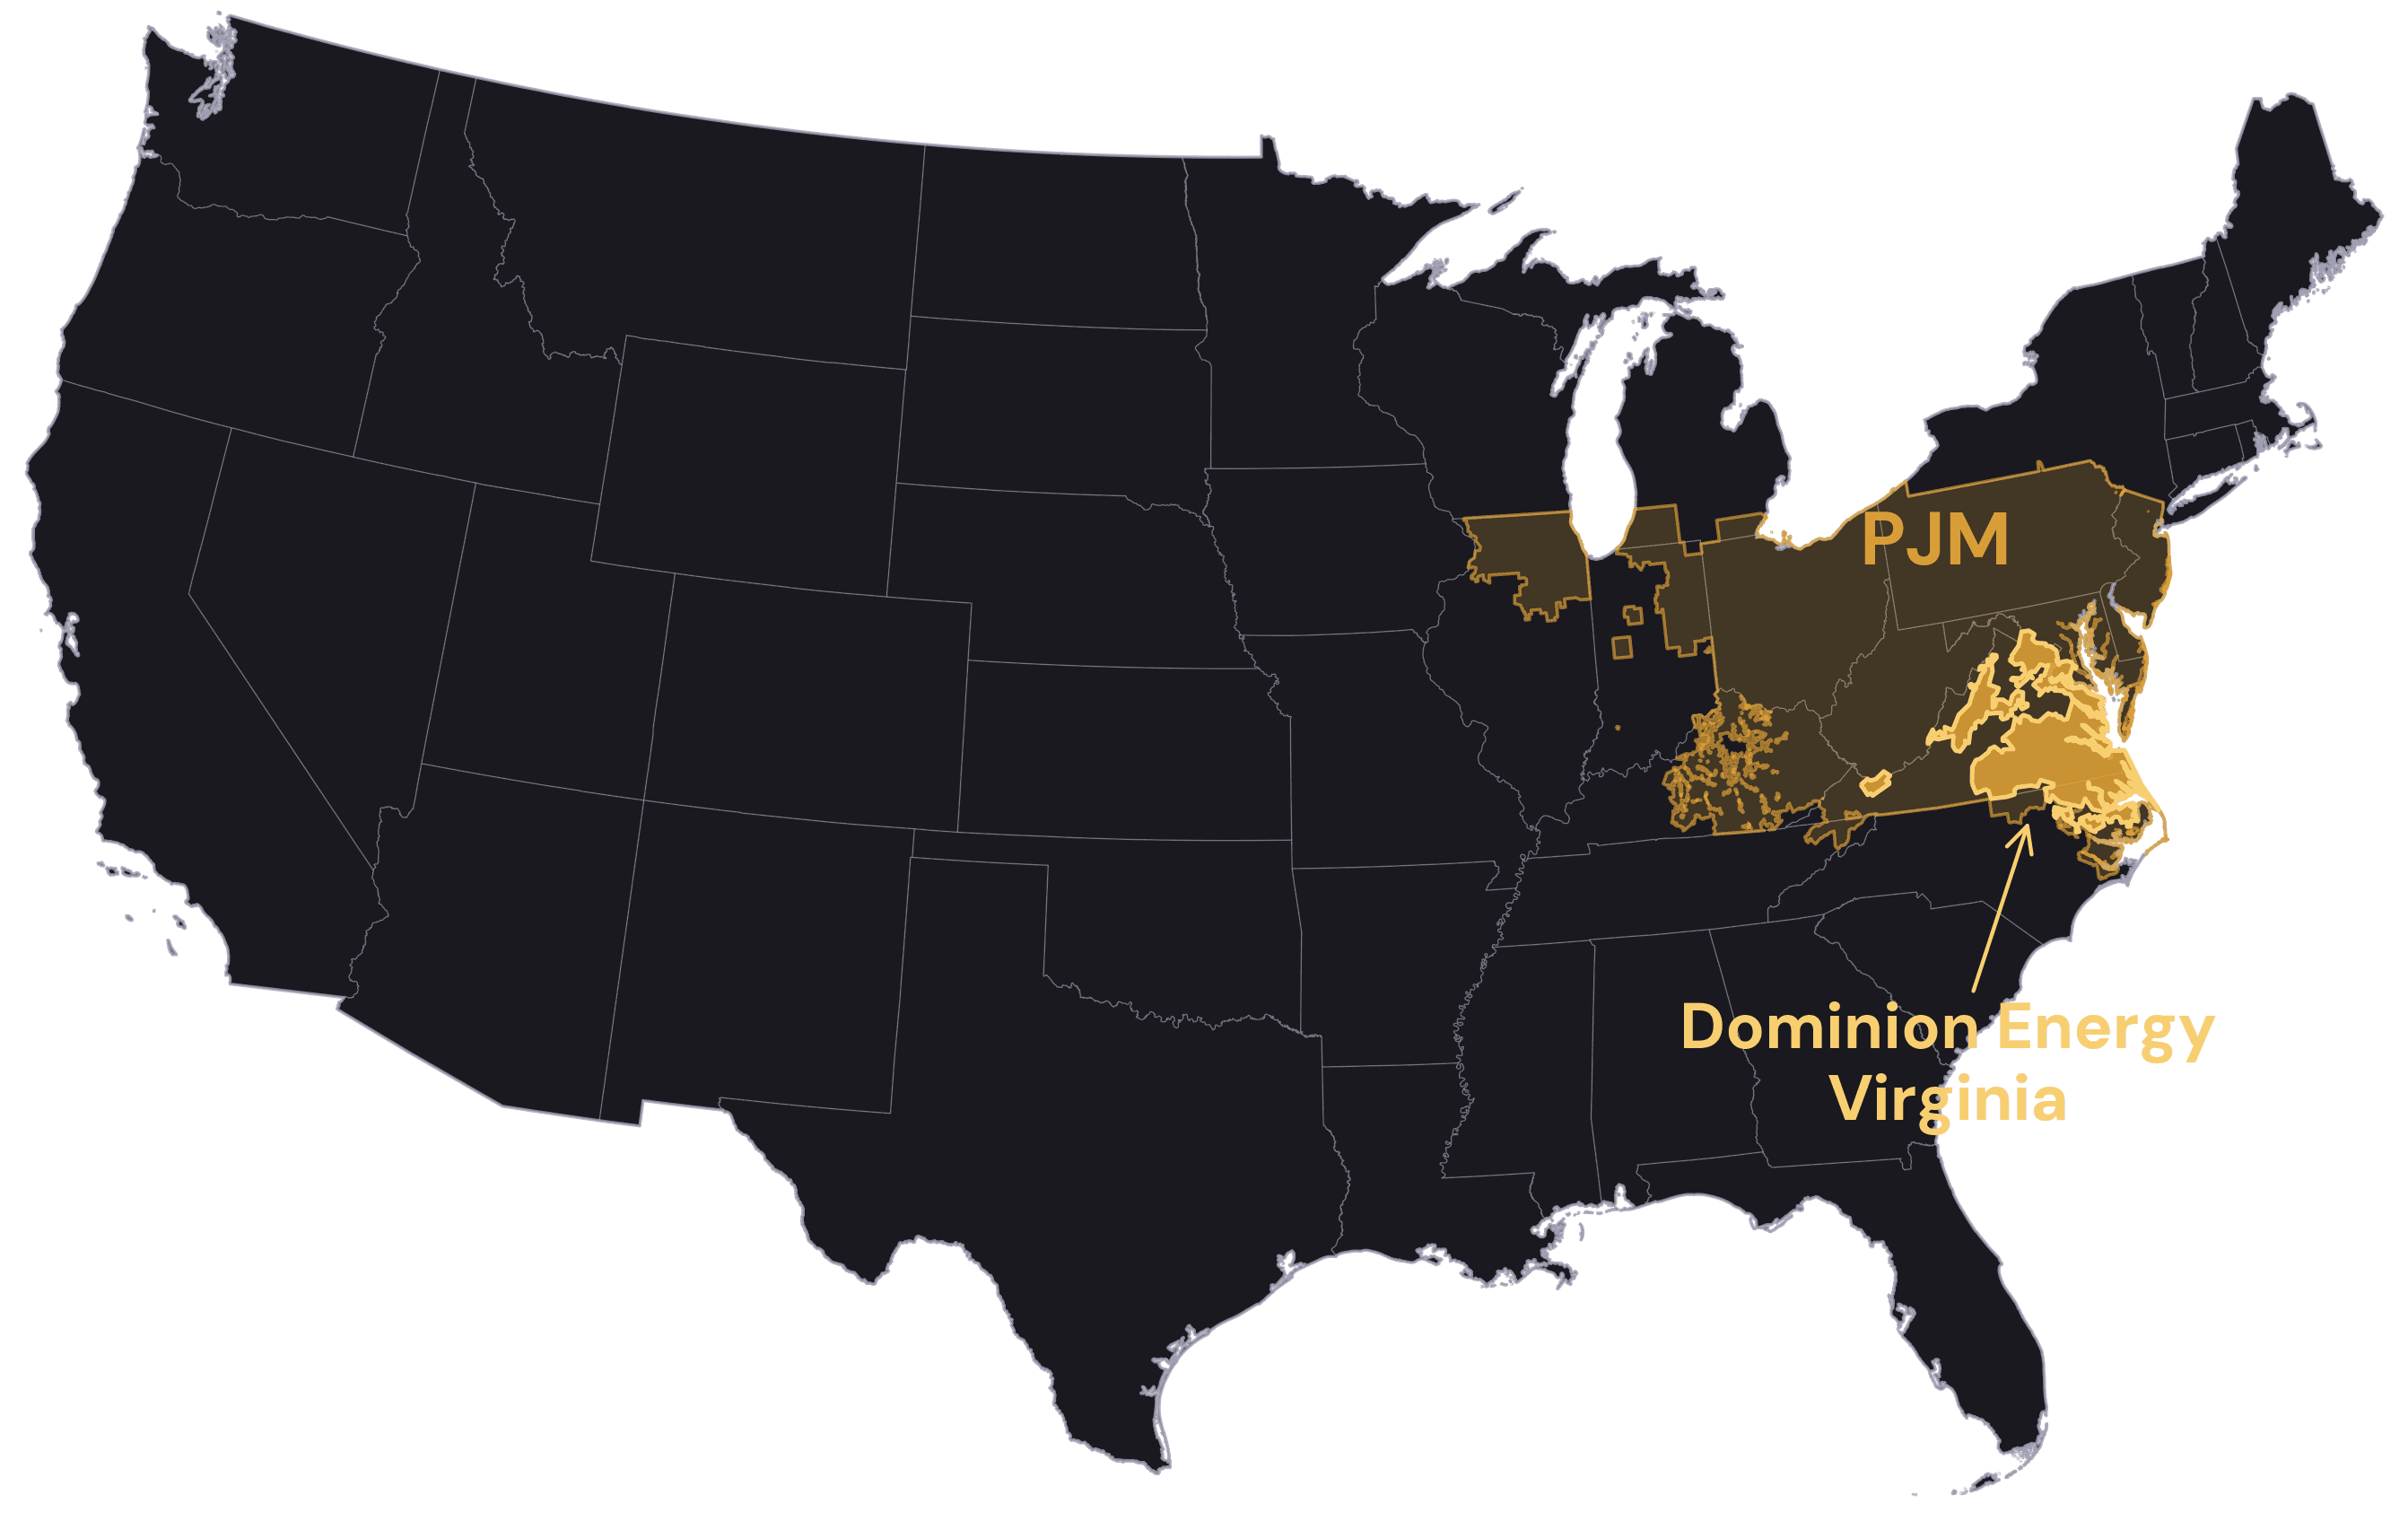
Northern Virginia is the world's largest data-center market, home to about 13% of reported global data-center capacity and 25% of capacity in the Americas.# Serving that load is driving a major expansion of Dominion's grid. This case study reconstructs how it happened, and shows where demand flexibility could change the outcome.
Key takeaways
- A typical Dominion household's bill rose about 38% in four years, from about $127 to $176 a month. Nearly three-quarters of that increase came in the last year alone. Clean-energy mandates, the local distribution grid, and fuel drove most of it. Data centers are a smaller part of the rise so far, but the main driver of what gets built next.
- Data centers have asked to connect roughly 70 GW of new power in Dominion's territory, nearly three times the grid's all-time peak. Serving even a fraction means new generation and a major grid expansion. That comes on top of the clean-energy transition Virginia mandated in 2020, before the data-center surge.
- Households are billed the largest share of that new buildout: about 53 to 55% of transmission cost and 40% of generation cost, the biggest single share of each, even though they use only about a third of the energy (~35%). The data-center-heavy class driving the growth is billed about 16 to 18% of transmission. That split is a billing choice, not a measure of who causes the cost. A new GS-5 rate class for large data centers, effective 2027, is starting to shift it.
- More increases are already in place or scheduled. A fuel charge rose in July 2026 (about +$8 a month on a 1,000 kWh residential bill). On September 29 the SCC approved that rate and authorized a seven-year securitization of the fuel deferral; if Dominion issues the bonds, they add a bond charge it expects to start in early 2027 (about $3 a month by its estimate). Regional capacity prices are at their administrative ceiling for the 2026/2027 and 2027/2028 auctions. PJM's market monitor ties about 40% of that auction cost to data-center load, the largest single driver (an independent review finds retirements and market-design changes together account for a comparable share), though it reaches bills only indirectly and on a lag. Virginia Commission Staff put the capacity cost embedded in a typical residential bill at about $4.37/mo in the 2026 rate year (rising to $5.66 in 2027), a total across all drivers, not a data-center-specific charge, and embedded in base generation rather than a separate line. Independent state analysts (JLARC) project data-center-driven growth could raise a typical residential customer's monthly generation and transmission charges by $14 to $37 by 2040, in 2024 dollars.
- Demand flexibility (shifting or trimming use when the grid is stressed) deploys in months instead of the years a power plant takes, and goes largely unused. Dominion's grid is built for a roughly 25 GW peak it reaches only a handful of hours a year (average demand is about 15 GW). Fewer than 1% of households are on time-based pricing. The state's virtual-power-plant pilot is capped under 2% of peak.
Four years of change, and what is already scheduled, in one view. Each row links to the section that sources it:
| What changed, Jun 2022 to Jun 2026 | What is in the pipeline | |
|---|---|---|
| Demand | Highest peak 25.2 GW (25,181 MW on July 3, 2026, 13 MW above February 2026), up 44% from 2019-20; contracted capacity grew from 16.5 GW in July 2023 to 53.8 GW in July 2026 | Data-center peak rising 3.6 GW (2024) to 13.4 GW (2038) per the IRP; ~25 GW of the queue has connection dates through 2031; PJM net summer-peak growth of 34.6 GW for 2026-2031, with load adjustments of about 33 GW in zones PJM adjusts for data centers |
| Supply | Legacy power-station riders rolled off; the 944 MW Chesterfield gas peaker was approved (due around 2029) | ~10.0 GW of announced nameplate accredits to only ~6.2 GW firm; 3 GW Cumberland gas plant targeted 2033-34; 19.5 GW of storage mandated by 2045 |
| Imports | Peak import capability (CETL) has fallen in each of the last two PJM auctions even as the zone's emergency import need rose; it can no longer import as much capacity as it would need under emergency peak conditions | At least ~6 GW of new delivery into Northern Virginia across four backbone transmission projects, entering service between 2028 and the early 2030s, all delayed or multi-year |
| Grid investment | $1.343 billion per year of transmission cost already in rates today | Three overlapping measures, not a sum: a $7.6 billion Dominion transmission inventory (33% primarily data-center-driven); an $11.8 billion PJM regional plan board-approved in February 2026 (the Dominion-zone HVDC backbone within it is about $4.8 billion); and $22.4 billion through 2039, the net present value of the 15-year plan (mostly new generation and storage) that Dominion's modeling attributes to data-center load |
| Prices and bills | Residential +38%, mid-commercial +36%, large-load +34%; PJM wholesale cost +48.9% in 2025 alone (Dominion-zone real-time price +67.9%, the largest of any zone), capacity component +262% | July 2026 fuel factor adds ~0.8 ¢/kWh for every class (+$7.97/mo residential), approved by the SCC on September 29 together with an authorized seven-year fuel securitization (if Dominion issues the bonds, it expects a bond charge from early 2027); capacity auctions at the cap feed the 2027 biennial review; JLARC projects +$14-$37/mo on residential bills by 2040 |
| Flexibility | 17 thermostat events (50 hours) dispatched in 2025; time-of-use reaches under 1% of households; 99% smart-metered but the default rate is peak-blind | 450 MW VPP pilot ramping through Aug 2026; large-load flexibility filings due Jan 2027; GS-5 minimum-demand terms effective Jan 2027 |
| Rules and ownership | Biennial rate reviews restored (HB 1770); data-center cost bill enacted (HB 1393, SCC directed to prevent cross-subsidy of 25 MW-plus loads); GS-5 rate class approved | NextEra's all-stock acquisition of Dominion filed with the SCC on July 15, 2026 as PUR-2026-00112; allocation-reform proceeding (SB 339) carried to 2027; PJM capacity-market redesign underway |
- What changed, Jun 2022 to Jun 2026
- Highest peak 25.2 GW (25,181 MW on July 3, 2026, 13 MW above February 2026), up 44% from 2019-20; contracted capacity grew from 16.5 GW in July 2023 to 53.8 GW in July 2026
- What is in the pipeline
- Data-center peak rising 3.6 GW (2024) to 13.4 GW (2038) per the IRP; ~25 GW of the queue has connection dates through 2031; PJM net summer-peak growth of 34.6 GW for 2026-2031, with load adjustments of about 33 GW in zones PJM adjusts for data centers
- What changed, Jun 2022 to Jun 2026
- Legacy power-station riders rolled off; the 944 MW Chesterfield gas peaker was approved (due around 2029)
- What is in the pipeline
- ~10.0 GW of announced nameplate accredits to only ~6.2 GW firm; 3 GW Cumberland gas plant targeted 2033-34; 19.5 GW of storage mandated by 2045
- What changed, Jun 2022 to Jun 2026
- Peak import capability (CETL) has fallen in each of the last two PJM auctions even as the zone's emergency import need rose; it can no longer import as much capacity as it would need under emergency peak conditions
- What is in the pipeline
- At least ~6 GW of new delivery into Northern Virginia across four backbone transmission projects, entering service between 2028 and the early 2030s, all delayed or multi-year
- What changed, Jun 2022 to Jun 2026
- $1.343 billion per year of transmission cost already in rates today
- What is in the pipeline
- Three overlapping measures, not a sum: a $7.6 billion Dominion transmission inventory (33% primarily data-center-driven); an $11.8 billion PJM regional plan board-approved in February 2026 (the Dominion-zone HVDC backbone within it is about $4.8 billion); and $22.4 billion through 2039, the net present value of the 15-year plan (mostly new generation and storage) that Dominion's modeling attributes to data-center load
- What changed, Jun 2022 to Jun 2026
- Residential +38%, mid-commercial +36%, large-load +34%; PJM wholesale cost +48.9% in 2025 alone (Dominion-zone real-time price +67.9%, the largest of any zone), capacity component +262%
- What is in the pipeline
- July 2026 fuel factor adds ~0.8 ¢/kWh for every class (+$7.97/mo residential), approved by the SCC on September 29 together with an authorized seven-year fuel securitization (if Dominion issues the bonds, it expects a bond charge from early 2027); capacity auctions at the cap feed the 2027 biennial review; JLARC projects +$14-$37/mo on residential bills by 2040
- What changed, Jun 2022 to Jun 2026
- 17 thermostat events (50 hours) dispatched in 2025; time-of-use reaches under 1% of households; 99% smart-metered but the default rate is peak-blind
- What is in the pipeline
- 450 MW VPP pilot ramping through Aug 2026; large-load flexibility filings due Jan 2027; GS-5 minimum-demand terms effective Jan 2027
- What changed, Jun 2022 to Jun 2026
- Biennial rate reviews restored (HB 1770); data-center cost bill enacted (HB 1393, SCC directed to prevent cross-subsidy of 25 MW-plus loads); GS-5 rate class approved
- What is in the pipeline
- NextEra's all-stock acquisition of Dominion filed with the SCC on July 15, 2026 as PUR-2026-00112; allocation-reform proceeding (SB 339) carried to 2027; PJM capacity-market redesign underway
Every figure in this table appears with its source citation in the linked section. Queue and pipeline figures are requests and plans, not realized load or completed construction.
The Pattern
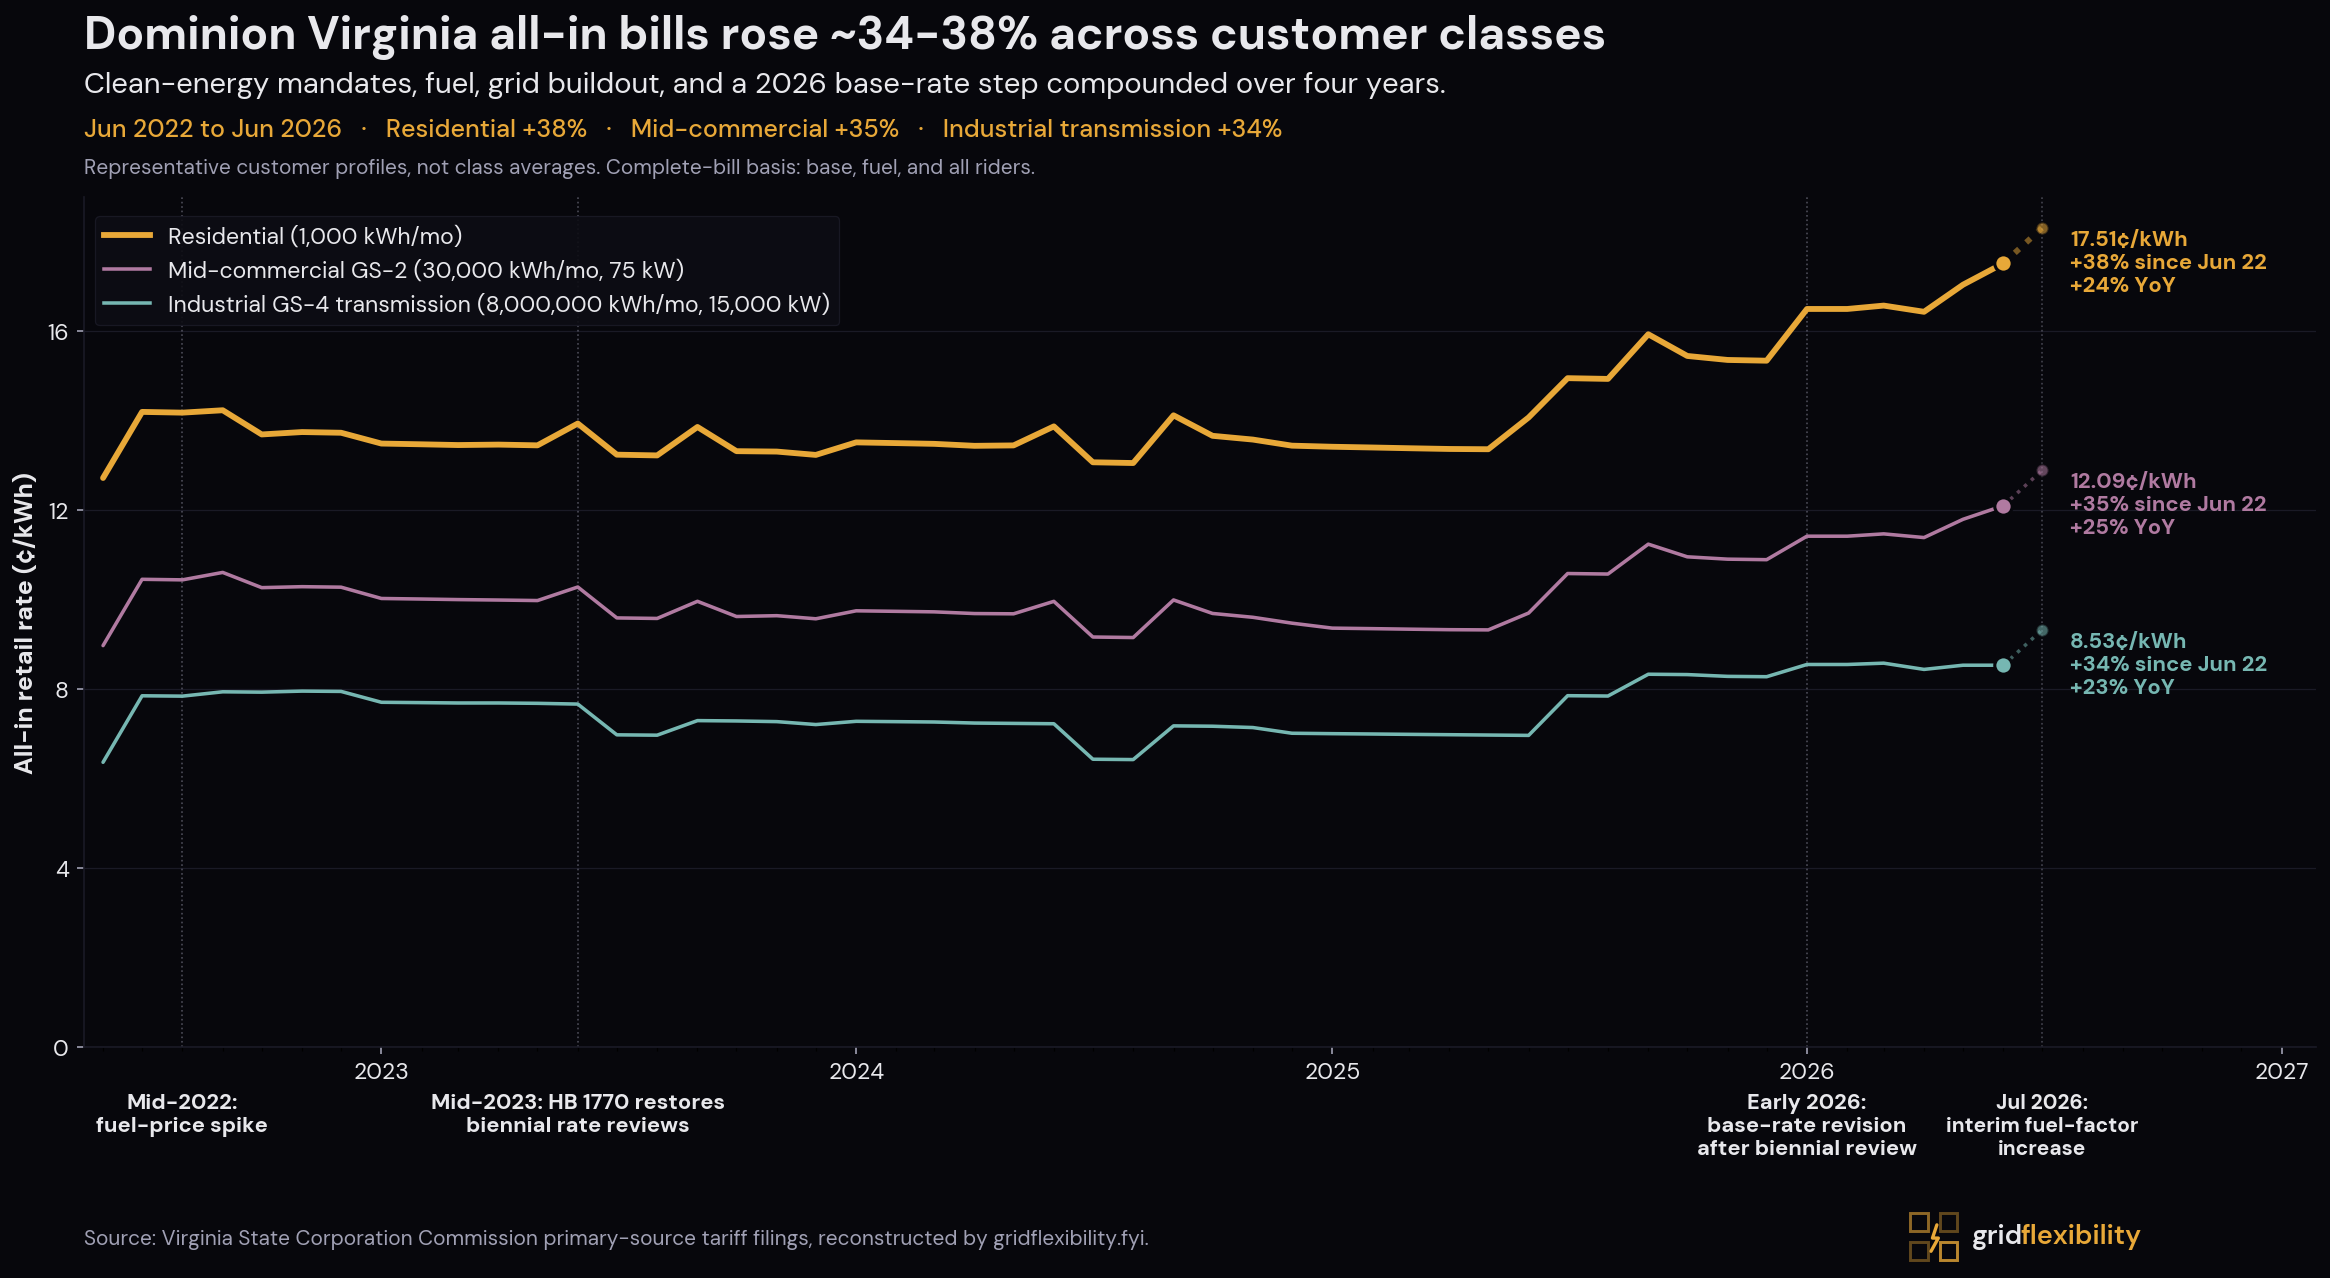
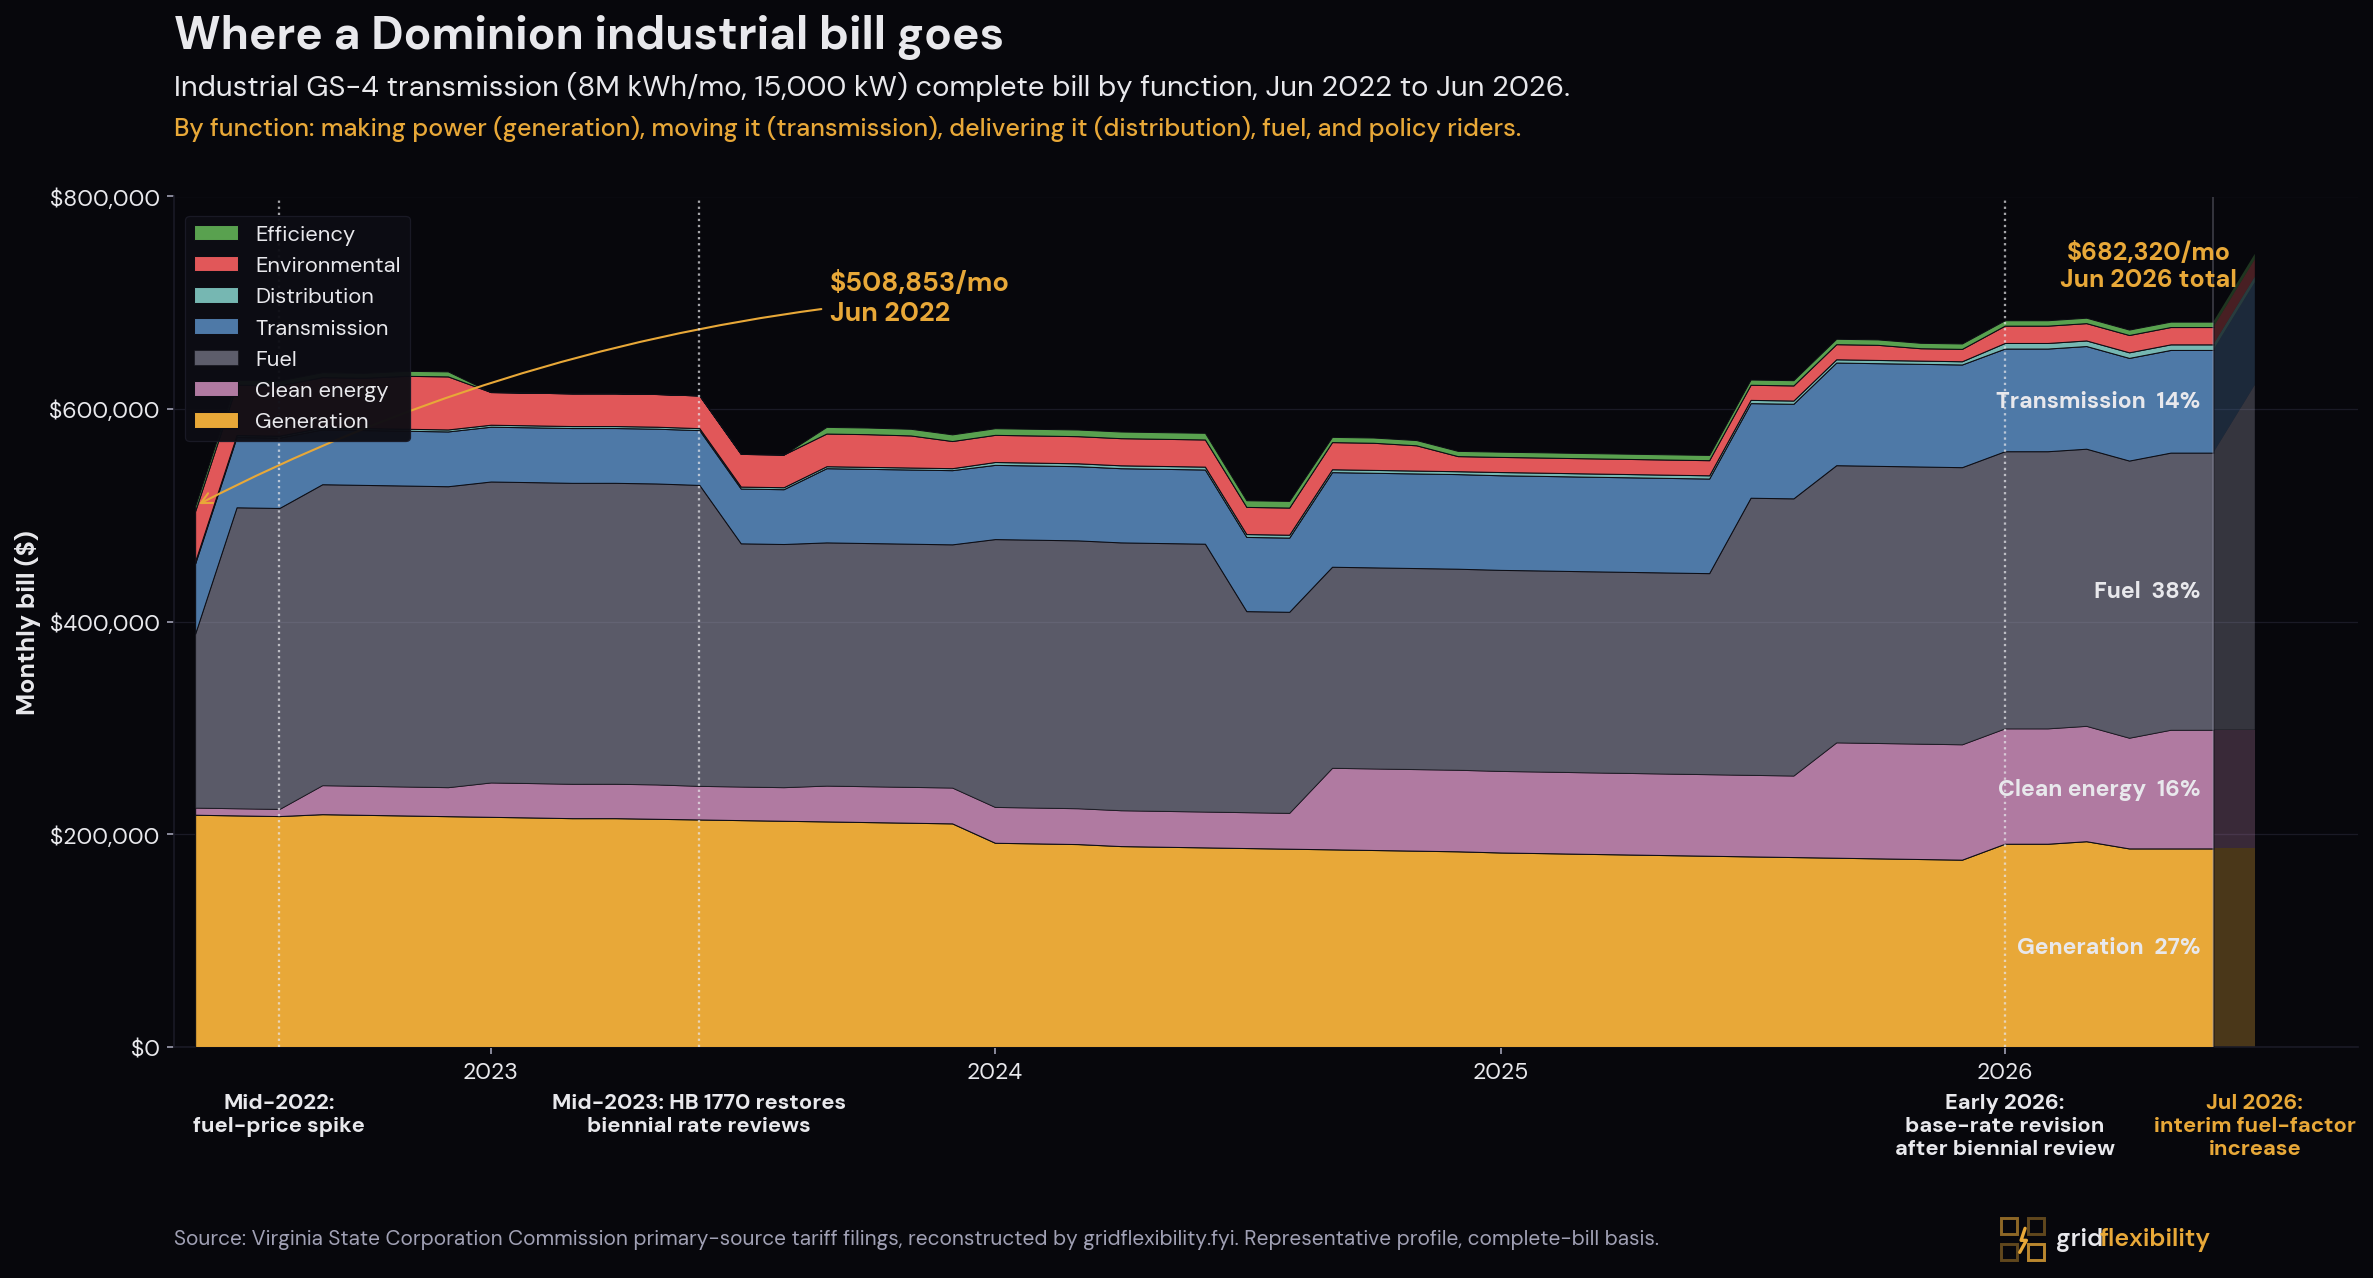
The chart shows three representative Dominion customer profiles. Residential (Schedule 1, 1,000 kWh/mo) climbed roughly 38%; mid-commercial (GS-2, 30 MWh per month, 75 kW peak) climbed roughly 36%; large-load (GS-4, 8 GWh per month, 15 MW peak) climbed roughly 34%. The divide is in what each class pays in absolute terms (residential pays 17.6 cents per kWh all-in against the large-load profile's 8.5 cents, just over twice the rate, on the complete-bill basis) and what share of the buildout it is allocated.
A few events shape the trajectories. A mid-2022 fuel-price spike (the Russia-Ukraine pass-through) lifts all three lines roughly in parallel, then partly resets. Virginia's HB 1770 restored biennial rate reviews in 2023 after the prior rate-freeze era: a regulatory regime change that enabled the later rider and base-rate buildout rather than a visible step on the line (the recurring June bumps are the seasonal generation reset, not a one-time event). The single largest durable build in the series is the mid-2025 rider ramp, with offshore wind, RPS, storage, SMR, and Rider T1 transmission all stepping up between June and September 2025. And an early-2026 base-rate revision (Dominion's 2025 biennial review, PUR-2025-00058) drives the visible final step upward. Those last two events are why nearly three-quarters of the residential increase landed in the final year of the window.
The buildout now entering rates responds to load growth without precedent in this system, and it is being financed under allocation rules set decades ago.
A larger structural change is also underway: in May 2026 Dominion agreed to be acquired by NextEra Energy in an all-stock merger. The joint petition reached the Virginia SCC on July 15, 2026 as PUR-2026-00112. The companies propose $2.25 billion in shareholder-funded bill credits across Virginia and the Carolinas over two years after close, and their own testimony puts Virginia's share at about $1.78 billion, or roughly 79%, apportioned by each state's 2025 electric energy sales. That is designed to give a typical 1,000 kWh residential customer $10 a month for two years, computed from each customer's own 2026 and 2027 usage rather than paid flat, with commercial and large-load classes drawing on the same pool. The terms propose credits, not changes to class cost allocation, so the framework this case study traces stays in place as filed.
Demand Pressure
Dominion's load-growth signal is now visible at multiple layers of the system. The Dominion zone's peak load reached 25.2 GW (25,181 MW) on July 3, 2026, up 44% from the zone's 2019-20 winter peak of 17.5 GW. It is 13 MW above the 25,168 MW set on February 9, 2026, which had topped the 24.7 GW set in January 2025 (PJM verified metered load for July 3; Grid Flexibility analysis of PJM DOM-zone hourly load through June 30, 2026). Counting 2026 so far, the annual peak since 2018 has fallen in summer five times and winter four. The all-time high has been broken three times since July 2024 (January 2025, February 2026, July 2026).# Dominion's 2024 Integrated Resource Plan (PUR-2024-00184) and its 2025 Update (PUR-2025-00184) indicate data-center peak demand rising from about 3.6 GW in 2024 to 13.4 GW in 2038, with total electricity usage rising more than 100% over a 15-year horizon. As of July 2023, Dominion signed engineering, construction, or service agreements covering 16.5 GW of data-center capacity. By July 2026 that reached 53.8 GW (Dominion Q2 2026 earnings slides, slide 5). Most of the increase arrived in one five-month stretch. Between July and December 2024 the total rose 18.8 GW, and 18.6 GW of it sat at the engineering-letter stage, the earliest of the three and the one furthest from a meter. None of it is energized load.
This article treats those figures as different demand states, not interchangeable totals: forecast peak demand (planning), queue requests (pipeline), and contracted/energized load (realization).
Per Dominion's Q4 2025 earnings disclosures, the contracted stages below are reported; the request-only balance and the ~70 GW total come from Dominion's SCC filing in PUR-2026-00011 (as of Dec 31, 2025). Each request is at one current stage; the rows don't overlap.
| Current stage in Dominion's contract process | GW | Share of queue |
|---|---|---|
| Binding service contract signed | ~10.2 | ~15% |
| Conditional service letter signed (not yet binding) | ~11.0 | ~16% |
| Engineering-study agreement signed (no service contract yet) | ~27.4 | ~39% |
| Request submitted, no agreement yet | ~21.5 | ~31% |
| Total queue | ~70.0 | 100% |
Separately, per Dominion's SCC filing, approximately 25 GW of the 70 GW total have been assigned projected connection dates through December 31, 2031; the remaining 45 GW are still under study to determine connection dates. Dominion also reports receiving roughly ten new large-load DP requests per month, representing 2-3 GW of additional requested load each month. The standards apply to requests serving data-center customers in the DOM Zone at approximately 100 MW or more. Dominion's Q2 2026 earnings slides (slide 5, July 31, 2026) put contracted capacity across the three authorization stages at about 48.5 GW in December 2025, about 51.0 GW in March 2026, and about 53.8 GW in July 2026, about 5.3 GW or 11% above December.
A note on forecasts. For external context, PJM's 2026 Load Forecast Report provides the total-load input for a Grid Flexibility decomposition of roughly 35 GW of PJM RTO non-coincident, unrestricted summer-peak growth from 2026 to 2031. PJM's load adjustments add about 33 GW over those years in zones whose forecasts it adjusts for data centers (Table B-9). The DOM zone has the largest single-zone increase. Realization rates from comparable markets reinforce that queues attrit: ERCOT applies a ~50% realization rate to its large-load queue, and SPP reports ~39% conversion of requests to signed service agreements. Virginia is also moving to scrutinize the forecasts directly: 2026's HB 892 directs the SCC to open a single statewide proceeding into how Virginia's Phase I and Phase II utilities and electric cooperatives, Dominion included, forecast load and whether those forecasts incorporate risk-minimization terms such as financial commitments and minimum-demand obligations. The Data Centers page covers the broader forecasting discussion.
Supply and Imports
The Dominion (DOM) zone at a glance
The zone is roomy on an average day and tight at the peak hour: its firm capacity (about 20 GW) already falls short of its 2024 peak of about 23 GW, and the zone's record hit 25.2 GW on July 3, 2026, so the zone leans on imports at the hours when power is hardest to get.
Average load (about 15 GW in 2025) is about 62% of the annual peak, so the grid is built for a peak it reaches only a handful of hours a year.
The local fleet generates only about 43% of its 27 GW nameplate; against firm, accredited capacity of about 20 GW, that same output is roughly a 57% capacity factor.
About 18% of the zone's energy is supplied from outside it over a year.
The peak import lifeline it depends on has fallen about 19% over the last two PJM auctions, to 5,992 MW for 2028/2029, below what a peak emergency would require.
Grid Flexibility calculations for the DOM zone. Load factor from DOM-zone hourly load for calendar 2025 (PJM/EIA): average load about 15.3 GW against a 24.7 GW peak, a 62% load factor (2024 was 61%). Generation capacity factor and net-import dependence use the latest published EIA annual data (2024 vintage; EIA-923 net generation against EIA-860 nameplate), since EIA's 2025 annual generation data is not released until later in 2026. Firm capacity derates intermittent supply to PJM-style ELCC ratings (solar ~11%, wind ~15%, storage ~50%) and holds thermal and nuclear at net summer rating, where PJM accredits them near full (gas ~80%, nuclear ~95%); about 18% of annual energy is net-imported. Emergency import capability (CETL) from PJM's 2028/2029 Planning Period Parameters, where CETL (5,992 MW) now sits below the zone's emergency import need (CETO 7,758 MW, a 0.77 ratio), detailed below.
Supply position. Dominion's bill pressure reflects both what is getting built and when it can reliably reach DOM-zone load. On the procurement side, PJM's capacity auctions show the Dominion zone's exposure: it cleared at a steep local premium in the 2025/2026 Base Residual Auction, and although that specific zonal constraint later eased, region-wide prices have since climbed to the auction cap (detailed below).
Dominion's full announced generation program totals roughly 10.0 GW of nameplate (6.1 GW intermittent plus 3.9 GW of new gas) but only about 6.2 GW of firm, accredited capability, set against data-center peak demand the IRP puts at 13.4 GW by 2038 and a request queue Dominion reported at about 70 GW. The rest of this section is that program in two halves, intermittent then firm.
Most of the pipeline is intermittent, and intermittent nameplate is not firm capacity. Applying PJM's published class accreditation ratings to the DOM-zone pipeline (ELCC, Effective Load Carrying Capability, is the share of a resource's nameplate that reliably counts toward meeting peak), roughly 6.1 GW of nameplate solar, wind, and storage accredits to only about 2.3 GW of firm capacity, a blended ~38% ELCC.
On the firm side, Dominion is advancing new dispatchable gas, but it arrives years out. The 944 MW Chesterfield Energy Reliability Center peaker was approved in 2025 (and is being challenged by environmental groups), with completion around 2029. In May 2026 Dominion announced a proposed 3 GW Cumberland Energy Center combined-cycle plant targeted for 2033 to 2034 (SCC filing expected in 2027). The 3.9 GW of new gas supplies the firm capacity the intermittent pipeline lacks, but neither plant closes the near-term gap while the queue is filling now, with CERC due around 2029 and Cumberland in 2033 to 2034. (The 6.1 GW intermittent figure counts only the solar, wind, and storage in the DOM zone's EIA-reported planned additions; the gas plants run through separate proceedings and are not in it.)
Dominion's own modeling isolates how much of this buildout is for data centers. In the SCC-directed sensitivity (2024 IRP Supplement, Figure 3.1), re-running the resource plan with no data-center load growth cuts planned wind by 98% (3,460 to 60 MW), eliminates all new nuclear (1,340 MW), cuts storage by 44% (4,100 to 2,250 MW), and cuts new gas by 57% (5,934 to 2,580 MW); only solar holds. That puts the data-center-driven increment at about 37% of the buildout, and an independent state model (JLARC Report 598) puts the data-center share of new generation through 2040 at 37 to 61%. Dropping data-center load also cuts the plan's net present value by about $22.4 billion (roughly 21%).
Almost none of this is replacing retiring plants. Nationally, firm capacity is retiring faster than reliable replacement comes online; Dominion is the exception, with no generation retirements planned before 2045 and none scheduled in federal data. Its buildout is additive load growth, not replacement.
Resource detail behind the accreditation figures: offshore wind carries most of the intermittent pipeline's firm total (2.64 GW nameplate at a 69% rating, about 1.82 GW firm); 3.94 GW of solar contributes about 434 MW firm (an 11% rating); 731 MW of four-hour storage adds about 366 MW. These figures separate nameplate from accredited capability and do not collapse planned, queued, and in-service resources into one realized number. Dominion's filings do not publish a complete resource-level ELCC table for each planned addition; the firm-capacity figures apply PJM's published 2026/2027 Base Residual Auction class accreditation ratings to Dominion's pipeline by resource type, the best available proxy where a Dominion-specific table is not public. Class ratings are an approximation, not a unit-by-unit ELCC study.
Four pieces of public evidence connect the grid buildout to data-center load in Dominion's service territory.
Evidence · Dominion IRP transmission inventory
Dominion's 2024 IRP (PUR-2024-00184) and its 2025 Update (PUR-2025-00184) list 203 planned transmission projects totaling $7.6 billion. Of those projects:
- $2.5 billion (33% of spend, 94 projects) are directly tagged as data-center-driven
- $3.3 billion (44% of spend, 37 projects) are mixed regional-reliability projects that include data-center load but cannot be attributed to a single customer type
- $1.8 billion (24% of spend, 72 projects) are not data-center-driven
Dominion witness Harrison S. Potter confirmed the project inventory and the data-center-driven subtotal during Day 2 of the IRP hearings. JLARC's rate-schedule analysis (with E3 as an independent consulting check that produced nearly identical splits) reports each class's allocated share, detailed in Who Pays and Why below.
These data-center-driven projects are recovered through Rider T1 and the base transmission component, which roll up into the transmission function in the bill stack in Prices and Bills below (Exhibit 17, Dominion response to Sierra Club / NRDC Request 7-7).
Evidence · PJM 2025/2026 capacity auction
PJM's 2025/2026 Base Residual Auction (cleared July 2024) priced the Dominion zone at $444.26/MW-day, $174 above the $269.92 RTO-wide price, which PJM attributed to insufficient in-zone resources and import limits. Dominion was no longer a constrained zone in 2026/2027, but RTO-wide prices have since reached the administrative cap ($329.17 for 2026/2027, $333.44 for 2027/2028). That is a real wholesale capacity-pressure signal, but it reaches the residential bill embedded, not as a line item: Dominion recovers generation through base rates, and the 2025 base-rate order kept its purchased PJM capacity expense in base rates rather than moving it into the fuel factor (a proposed ~$1.98/mo Rider A capacity component was rejected).
A falling visible line can still carry a large capacity cost embedded underneath it, and Commission Staff quantified it. After FERC's price collar cut Dominion's forward DOM capacity assumption from $499.32 and $545.50 to $329.17/MW-day, Staff put the purchased-capacity effect on a typical 1,000 kWh residential bill at $4.37/mo for the 2026 rate year and $5.66/mo for 2027 (Ex. 89, Carol Myers Staff Direct, Table 4, PUR-2025-00058), down from the $6.22 and $9.06 originally filed. Staff described the two rate years as converging “around approximately $5.00 per month.”
Those are total embedded purchased-capacity levels for each forward calendar rate year, not a data-center-specific bill share and not a realized Jun 2022 to Jun 2026 increase (the market monitor's ~40% figure is a share of the wholesale auction-cost increase, on a different denominator, and is never multiplied into a retail bill). The standard residential tariff bundles generation into one volumetric base-generation line that isolates no capacity portion, and that visible line fell about $4.36/mo over the window (the January 2026 base-rate step was dominated by distribution, detailed in Prices and Bills below). The fall reflects legacy plant depreciating off, not the absence of capacity, which sits embedded within that same line. Whether the capacity portion itself rose within the window is not resolvable from the public tariff.
Evidence · PJM Independent Market Monitor
Monitoring Analytics, the PJM Independent Market Monitor, attributes 40% of the 2027/2028 Base Residual Auction (cleared December 2025) and its $16.4 billion in clearing costs (~$6.5 billion) to data-center load. Across the last three capacity auctions combined (2025/2026, 2026/2027, and 2027/2028), data-center load added $21.3 billion in capacity costs. The market monitor's own framing: “Data center load growth is the primary reason for recent and expected capacity market conditions.”
That attribution is not single-factor. E3's 2026 review decomposes the capacity-price increase into roughly half load growth and roughly half supply-side and market-design factors: generator retirements, capacity-market parameter changes (the Net CONE and reliability-requirement adjustments), and FRR elections. Data-center load growth is the largest single driver, but retirements and market design together account for a comparable share.
Evidence · Wholesale-market stress in DOM zone
PJM's wholesale electricity markets show the same stress pattern. Monitoring Analytics' 2025 State of the Market Report (released March 2026) concluded that PJM's capacity markets for the 2025/2026, 2026/2027, and 2027/2028 Delivery Years were “not competitive, in significant part as a result of forecast demand for data centers.” Total wholesale electricity cost in PJM rose 48.9% in 2025 alone (from $55.52/MWh in 2024 to $82.67/MWh in 2025), with the capacity-cost component rising 262% in a single year. Within PJM, the Dominion zone saw the largest real-time price increase of any zone in 2025: its load-weighted real-time LMP rose 67.9%, from $39.07 to $65.58/MWh, per the PJM Independent Market Monitor's 2025 State of the Market Report (Table 3-53), which attributes the rise largely to high real-time congestion in the Dominion Zone. Our own analysis of hourly PJM market data corroborates the ranking (a 51% rise by that simpler, unweighted measure).#
On the reliability side, the DOM zone (PJM's name for Dominion's Virginia service territory) has less spare capability to import capacity from neighbors at peak, not more. (The constraint is on deliverable import capability at peak, which PJM models through its locational deliverability test, not on actual energy imports, which are rising as Dominion leans more on the broader PJM market.) Per PJM's 2028/2029 Planning Period Parameters, the DOM zone's Capacity Emergency Transfer Limit (CETL, its maximum import capability under peak emergency conditions) has fallen in each of the last two auctions, from 7,374 MW (2026/2027) to 6,598 MW (2027/2028) to 5,992 MW (2028/2029), even as the zone's emergency import need (CETO) rose from 5,511 MW to 7,758 MW, which PJM attributes largely to the significant load increases in northern Virginia. As a result DOM's CETL/CETO ratio has dropped from 1.34 to 0.77 over those two cycles, crossing below 1: the zone now cannot import as much capacity as it would need under emergency conditions, and the gap is widening. Transmission timing layers on top of load: the Chanceford-Doubs 500 kV backbone, required in service by June 2027, has been delayed, and PJM's December 2025 BRA results presentation tracks that delay as a separate auction-change item. These wholesale-market signals flow through Rider A (fuel factor) and through subsequent rate cases into customer bills with a 12-to-24-month lag.
PJM recomputes CETL and CETO for each Locational Deliverability Area every auction; the DOM declines above are net of all factors, including the transmission additions and delays noted above.
Transmission relief should eventually reduce fuel and energy costs, but on a delay. The buildout (funded by Rider T1 and base transmission rates) relieves the congestion driving DOM-zone wholesale-market premia, lets cheaper generation reach load, shrinks inter-zone price differentials, and lower wholesale costs eventually flow through Rider A into customer bills. PJM's board approved the 2025 Regional Transmission Expansion Plan in February 2026 at $11.8 billion across the PJM footprint, of which the HVDC backbone chosen for the Dominion zone is about $4.8 billion, recovered through the same Rider T1 and base-transmission path described above and spread across decades, so monthly bill impact lands gradually rather than as a single spike.
Four major projects target Northern Virginia: the Mid-Atlantic Resiliency Link (MARL), the Valley North 765 kV line (part of the Valley Link portfolio), the Chanceford-Doubs 500 kV backbone rebuild, and the Heritage-Mosby 525 kV HVDC backbone. Their publicly published incremental delivery into Northern Virginia sums to at least roughly 6 GW (Valley Link up to 3 GW into Loudoun County plus the Heritage-Mosby 3 GW bipolar link; MARL and Chanceford-Doubs publish no single incremental DOM-zone MW figure). All four are delayed or multi-year, with required in-service dates running from 2028 into the 2030s.
Projects of this scale typically take 5-10 years from approval to in-service, and data-center load growth has been faster than that. How much relief shows up once MARL, Valley North, and the Heritage-Mosby backbone come online (a loosened import constraint, more cheap power from neighbor zones, less renewable generation curtailed for lack of a path to load) depends on whether new data-center load fills the new headroom as fast as it arrives. PJM's load forecast adds roughly 5.1 GW of additional Dominion-zone data-center demand in the 2027/2028 delivery year alone, more than any single project in the queue is sized to relieve.
PJM's May 2026 market-design paper ( Powering Reliability Through Market Design) outlines a multi-year capacity-market reform effort, citing three drivers behind the region's move from surplus to scarcity: data-center demand growth that outpaces generation buildout, rising capital costs and longer construction timelines, and policy uncertainty. The 2027/2028 BRA cleared at the FERC-approved administrative cap noted above for the Dominion zone; without market reform or new generation, capacity-cost pressure will continue to feed into Dominion's base rates at each biennial review.
Prices and Bills
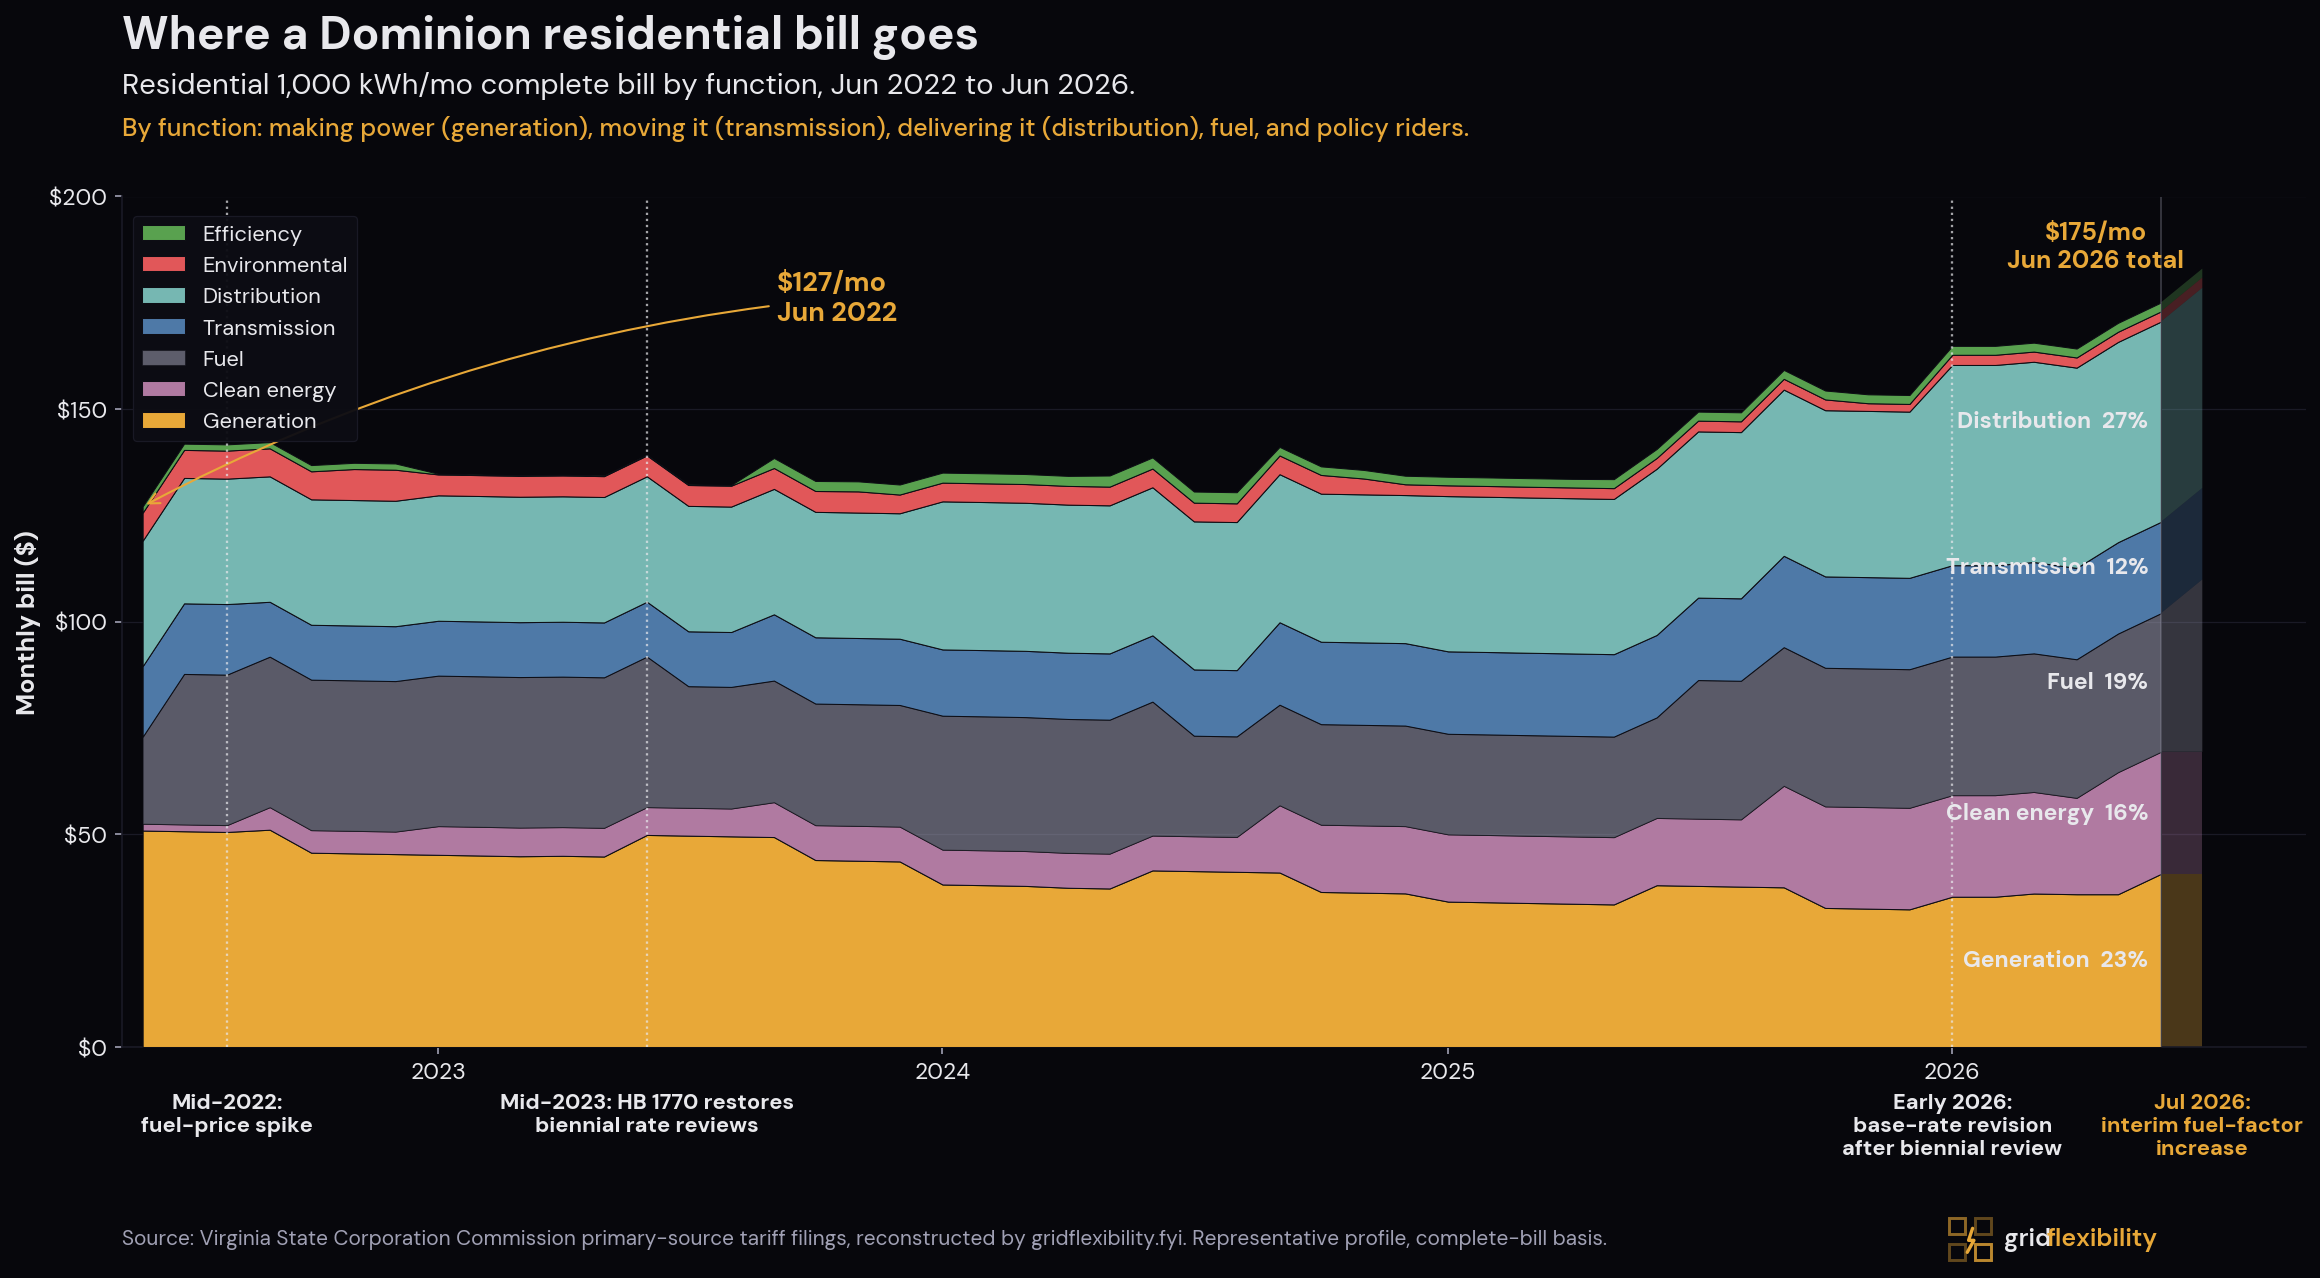
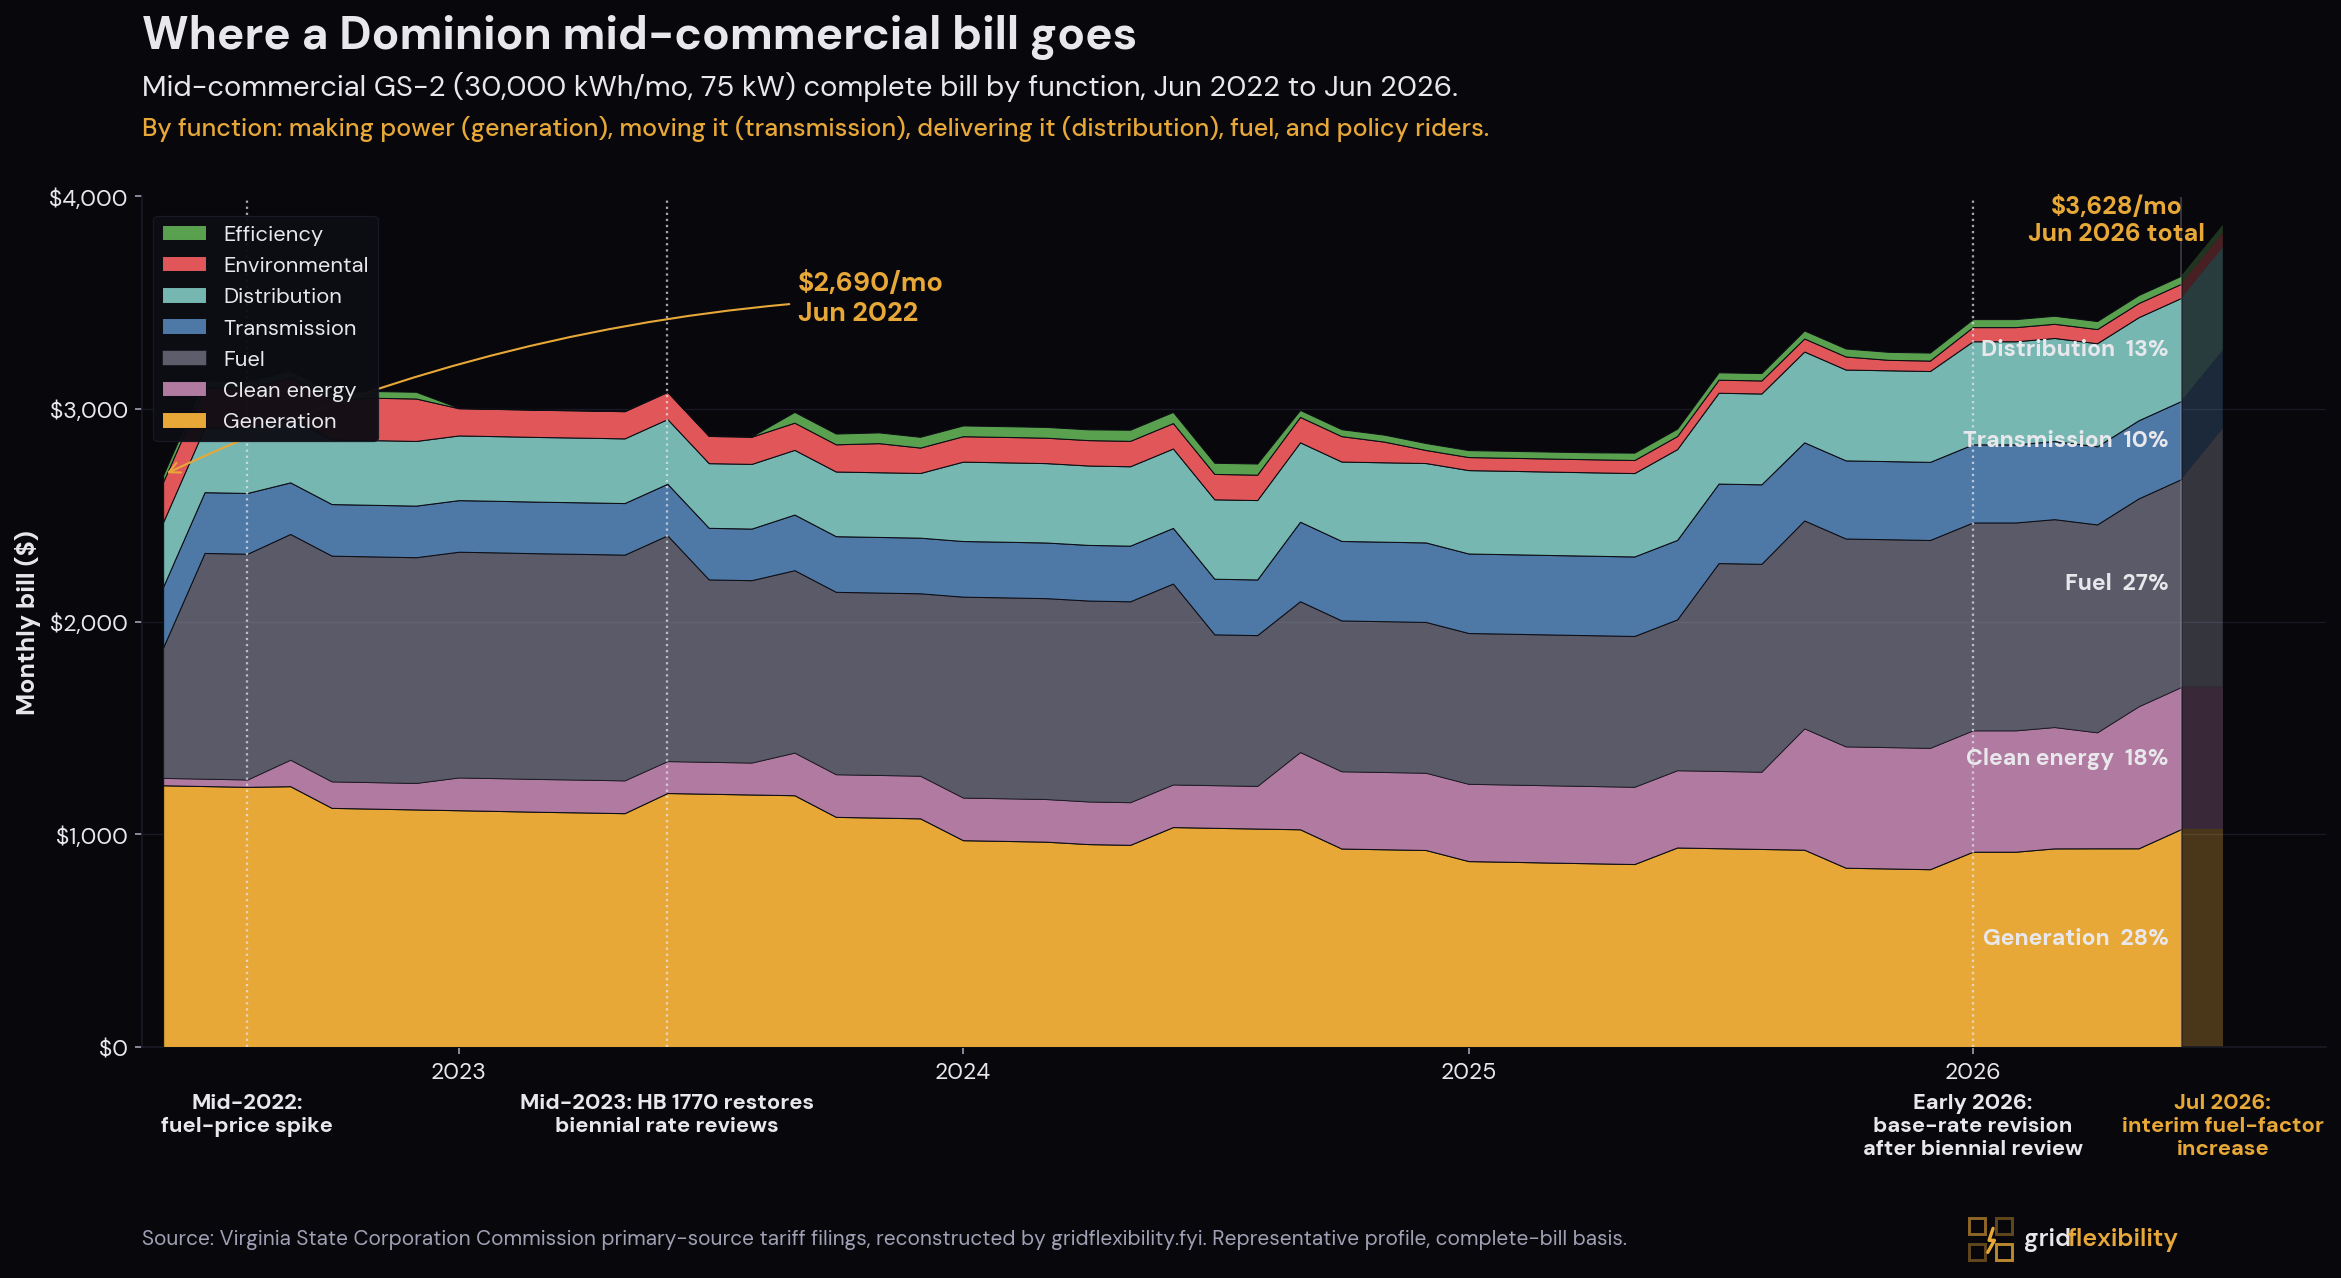
Read the bill by function: how much pays to make power (generation), move it (transmission), deliver it (distribution), buy fuel, and fund policy riders. By June 2026 a ~$176/mo residential bill is roughly 28% distribution, 23% generation, 19% fuel, 16% clean-energy mandates, and 12% transmission, with environmental and efficiency riders about 1% each. The bill rose about $49/mo over the window (~$127 to ~$176); four functions carried that growth, and two actually fell.
- Clean energy (+~$27/mo, the largest driver): from $1.61/mo in mid-2022 to $28.72/mo in mid-2026. The active riders (OSW, RPS, SNA, SMR, CE), plus the legacy utility-solar riders now folded into this function (the Scott, Colonial Trail West, Spring Grove, and Sadler solar projects), were authorized under Virginia's 2020 Clean Economy Act and ramped up as projects came online. By Jun 2026, Rider OSW alone (Coastal Virginia Offshore Wind) reaches roughly $11/mo for the residential profile. (Part of this function's growth is reclassification of pre-VCEA compliance cost out of base generation rates; see Methods.)
- Distribution (+~$19/mo): the local wires and equipment that deliver power. The largest single step, about $8 of the $19, is the January 2026 base-distribution revision approved in Dominion's 2025 biennial review (PUR-2025-00058). The 2024 and 2025 base-distribution steps added about $6, the customer charge added $1, and the transition from legacy Riders U and GT to Rider DIST added about $4. The Class Cost-of-Service Study filed in that case allocates demand-driven costs to residential customers based on their contribution to system peaks. The order raised base rates by about +$11/mo for a typical residential customer (the order states +$11.24/mo, or 7.5%; our Schedule 1 reconstruction puts the step at +$11.14/mo), a step about 72% distribution and 28% generation with base transmission flat, visible as the right-edge step on the chart. This is the function residential is allocated the largest share of. The distribution capital itself, per Dominion's 2025 integrated resource plan, is mostly grid modernization under the 2018 Grid Transformation and Security Act (smart meters, self-healing automation, distributed-resource readiness), the Strategic Undergrounding Program for storm resilience, and routine reliability and local-load work.
- Fuel (+~$12/mo): the fuel function (Rider A plus the deferred-fuel surcharge), with the mid-2022 Russia-Ukraine spike and a subsequent partial reset visible as the cleanest event-driven shape on the chart. Rider A tracks two forces, the wholesale energy price and the growing volume Dominion buys from the PJM market rather than self-generates; the July 2026 increase decomposes to 71% purchased power and is volume-led, from a Grid Flexibility analysis of the primary fuel schedules (detailed below).
- Transmission (+~$5/mo): the high-voltage network (base transmission plus Rider T1), the function most directly tied to the load-growth interconnection the data-center buildout is driving.
Two functions actually fell over the window:
- Generation (about -$10/mo): the legacy power-station riders (the Bear Garden, Warren County, Brunswick, and Greensville gas plants, the Virginia City hybrid plant, and the biomass conversions) depreciated and rolled off faster than new generation costs came on, so the function net-declined even as Dominion added the new Rider GEN and the Chesterfield Energy Reliability Center gas peaker (CERC). New generation investment is moving to clean energy under the VCEA, but that cost lands on the separate clean-energy line, not here. So this decline is not the flip side of the ~$27/mo clean-energy increase: the old fossil plants were always going to depreciate off on schedules set when they were built, while the clean-energy mandate ramps at nearly three times the size. Embedded PJM capacity cost pushes the other way inside this function: Commission Staff put the residential capacity component at about $4.37/mo in the 2026 rate year (see Supply and Imports), so the net base-generation decline is consistent with legacy depreciation rolling off faster than embedded capacity cost builds, not with an absence of capacity pressure. Generation is still ~23% of the bill, the second-largest slice.
- Environmental (about -$4/mo): coal-ash remediation (Rider CCR) ran off and Virginia withdrew from the Regional Greenhouse Gas Initiative in 2023. Rider C1A rose from $0.03/mo to $0.23/mo, while Rider C4A fell from $1.42/mo to $1.34/mo. Rider RBB rose from $0.03/mo to $0.53/mo before being folded into Rider DIST in June 2026.
Clean energy has two layers: the VCEA sets the mix (it must be renewable), but data-center load sets the level, since the renewable standard is a share of sales and data centers are nearly all of Dominion's load growth. The clean cost already on the bill is mostly offshore wind, a fixed statutory tranche (sized by the state's 2,500 to 3,000 MW mandate, not by load); the clean buildout still ahead is what scales with data-center load.
How the 2022 fuel shock compares to what is coming. The 2022 spike was a commodity event that Rider A passed through and later trued up. The current cost pressure is structurally different: it is dominated by capital, the cost of new generation, transmission, and clean-energy buildout entering rate base, not a one-time commodity shock. Data-center load growth is the major pressure on the transmission and capacity portion; distribution growth has its own driver (grid modernization). It lands more slowly (through capacity riders, base-rate proceedings, and transmission true-ups rather than a single fuel-factor adjustment), it is larger in cumulative dollars, and it does not revert when global conditions normalize. The capital sits in rate base and is recovered across decades.
The increase is not a 2022-style commodity spike; the largest driver is purchased power. On Dominion's forecast system fuel schedule, PJM purchases account for 71% of the forecast system fuel-expense increase from the 2025 to the 2026 filing ($845 million of $1.19 billion), and buying more outweighs paying more: forecast purchase volume rises 62% (16.0 to 25.9 million MWh, from 15% to 24% of system energy) while forecast prices rise 26% ($51 to $64/MWh). Dominion's own generation capacity has drifted down since 2018 (21.5 to 18.7 GW) while zone demand rose by about 31%, so incremental demand is increasingly served from the PJM market: the same load-growth pressure the buildout is responding to. Translating that system-level bridge into a retail bill impact requires a modeled allocation (the filings publish no by-source retail decomposition); using a proportional 2026 Rider A allocation, purchases map to roughly $7/mo of the $10/mo forward-looking component of the increase. The SCC's September 29, 2026 fuel-factor order recites a projected prior-period balance of about $1.078 billion (about $1.012 billion for 2025/26 plus $65.8 million carried from 2024/25). The approved fuel factor excludes the 2025/26 deferral and keeps the carry, which is why the July 2026 step is +$7.97/mo rather than +$21.79. The financing order authorizes bonds for about $922 million of updated deferred fuel costs plus $9.8 million of upfront costs and leaves issuance to Dominion; if issued, the bonds recover those costs through a separate charge.
Two complications compound this: gas-fired peakers typically set the marginal clearing price in PJM's energy market during scarcity hours, so a future Henry Hub spike would push both Rider A and the next capacity-auction clearing price up simultaneously, and the gas-price outlook is not pointed downward. EIA's May 2026 Short-Term Energy Outlook puts Henry Hub at roughly $3.50/MMBtu in 2026 and $3.18/MMBtu in 2027 (above the pre-2021 ~$2.50/MMBtu baseline), with LNG-export growth (projected to rise from 17.0 Bcf/d in 2026 to 18.2 Bcf/d in 2027) and rising data-center gas demand pointing to continued upward pressure. Easing fuel costs going forward requires relieving wholesale-market stress, which itself requires the transmission and generation buildout. The buildout costs then flow through other parts of the bill.
The July 2026 fuel-factor increase applies across all three customer classes. In case PUR-2026-00058, the SCC issued an interim order (May 29, 2026) placing Dominion's securitization fuel factor (3.7648 ¢/kWh, up from 2.968 ¢/kWh) into effect for July 1, 2026. On September 29 it approved that rate (order). The higher standard-recovery rate Dominion would have charged if the companion securitization petition (PUR-2026-00078) had been denied was not adopted. The table shows both outcomes for each customer class; assuming all other charges hold flat:
| Segment | Current bill (Jun 2026) | Approved rate (in effect Jul 1) | Standard recovery (not adopted) |
|---|---|---|---|
| Residential (Schedule 1, 1,000 kWh/mo) | $175.98/mo | +$7.97 (+4.5%) | +$21.79 (+12.4%) |
| Mid-commercial (GS-2, 30 MWh/mo) | ~$3,655/mo | +$239 (+6.5%) | +$654 (+17.9%) |
| Large Load (GS-4, 8 GWh/mo) | ~$682K/mo | +$64K (+9.3%) | +$174K (+25.5%) |
On September 29 the SCC approved both Dominion requests. The fuel-factor order approves the 3.7648 ¢/kWh rate (3.6749 current-period plus 0.0899 prior-period) for usage on and after July 1. It continues the case. Staff is to audit the deferred fuel balance as of June 30, 2026, with any adjustment made in that case. The financing order for PUR-2026-00078 authorizes bonds of up to about $931.85 million (the $922.06 million fuel deferral plus $9.79 million of upfront costs), with a scheduled final payment about seven years after the first bonds are issued. That is the term the chief hearing examiner recommended on August 25 (hearing examiner's report). Dominion had sought about ten years.
The order sets no monthly bond charge and leaves issuance to Dominion. If the bonds are issued, the initial charge is set after they are priced. Dominion's petition estimated about $3.05/mo for a 1,000 kWh residential bill on a seven-year bond, with the charge expected to begin in early 2027. The +$7.97/mo step stands. If the bonds are issued and Dominion's estimate holds, a bond charge of about $3.05/mo is added, roughly +$11/mo on a 1,000 kWh bill from fuel alone.
In the comment round that closed September 1, no party asked the Commission to reject securitization: Commission staff asked it to adopt the report outright, Dominion accepted the seven-year term over the ten it had sought (Dominion's comments), and the Attorney General's Consumer Counsel did not oppose either the interim rate or the seven-year term, which it called “the least objectionable option.” Sierra Club asked for five conditions on approval. The hearing examiner recommended that the Commission consider them. Neither September 29 order adopts them, and the fuel-factor order directs Dominion to evaluate and present, but not necessarily propose, a fuel-cost-sharing mechanism in its next fuel factor application. Sierra Club and Appalachian Voices also pressed for coal-cost disallowances, which the examiner's report rejected and the Commission did not order.
Short term (next 12-24 months), fuel and energy prices are more likely to rise than fall, per Dominion's April 2026 fuel-factor filing. The July 2026 factor prices the year ahead on March 27, 2026 forwards; costs above that curve accrue to a new deferral recovered in the next fuel case, the same loop that built the roughly $1.078 billion projected balance. On September 29, 2026 the SCC authorized bonds for about $922 million of deferred fuel costs plus $9.8 million of upfront costs. Medium term, the outlook depends on whether the transmission buildout catches up to demand, with no independent forecast currently projecting that it will during the next-3-years planning horizon.
Who Pays and Why
Much of the forward $7.6 billion transmission buildout is triggered by data-center load (per the IRP inventory above, including projects that serve only data centers), yet transmission cost is allocated by coincident-peak demand. Because those are different bases, residential is allocated to pay the majority share even for projects it did not trigger. Dominion's 2024 IRP testimony and JLARC Report 598 (Table 4-1) put residential at 53 to 55% of transmission-related cost allocation on that forward plan (53% under the independent consultant E3, 55% under Dominion's own rate schedules). The same pattern is already visible in current rates: of Dominion's present $1.343 billion annual transmission revenue requirement (Rider T1 plus the base transmission component, PUR-2025-00076), residential is assigned about $648 million, roughly 48% of the cost against about 35% of the energy, the highest per-kWh transmission rate of any class. The 53-to-55% is the allocation of the forward buildout; the 48% is residential's share of what is in rates today.
When Dominion proposes new infrastructure (transmission lines, substations, generation, distribution), the SCC's Class Cost-of-Service Study (CCOSS) divides the cost among customer classes. Costs are typically separated into three categories and allocated differently:
- Demand-based costs (generation, transmission, and distribution infrastructure): allocated by each class's contribution to the system peaks that drive the investment
- Usage-based costs (energy and fuel): allocated by each class's share of total kWh consumption
- Per-customer costs (billing, metering, customer service): allocated by customer count
The first allocation, demand-based by coincident peak, is the one that matters most here. Dominion's system peaks are typically summer afternoons (driven by residential air-conditioning) and winter mornings (driven by residential heating). Residential customers' contribution to those peak hours is large; their share of the peak determines their share of the demand-driven cost. The result, from the JLARC rate-schedule analysis (Report 598, Table 4-1) cited above, is the share each class is allocated: residential is allocated 40% of generation and 53% of transmission costs; GS-4 (most data centers) 26% and 18%; the remaining commercial and industrial classes split the balance (34% of generation and 29% of transmission). The Data Centers page section on who drives the peak walks through how PJM and Dominion measure these peak contributions across customer types, with a supporting chart.
Coincidence with those peak hours differs by class. Commercial load peaks on weekday afternoons (partial overlap). Data centers run at a high, steady load factor, giving them lower coincidence with the short peak hours that drive transmission allocation, even as their constant load raises the baseline and drives the infrastructure buildout. A transmission upgrade triggered by a specific large load is not billed to that customer; it is recovered from all classes by peak usage. The Union of Concerned Scientists estimated that roughly $4.4 billion of 2024 PJM transmission cost driven by data centers was socialized across all ratepayers this way (the net incidence is disputed), and E3, in a 2026 review funded by the Data Center Coalition (the data-center industry's trade group) but independently authored, concedes the mechanism: connection costs “were not designed to directly attribute to the specific customers that triggered them” and so are “paid by all ratepayers.”
The 2026 General Assembly moved on this directly, but not decisively. Among the 15 data-center bills it sent to the Governor, out of 61 considered, HB 1393 (signed May 2026) carries the operative language, and not in its title, which is about a weatherization pilot. An uncodified enactment clause directs the SCC, in the biennial review of a Phase II Utility (Dominion), to take all measures to reasonably ensure that costs associated with customers at 25 MW or greater demand and a 75 percent or greater average annual load factor are not being subsidized by other customers. The act never says “data center,” but that threshold describes one. The stronger measure, HB 503, which would have required that the cost of serving 100 MW-plus data centers be recovered only from those data centers, failed; and SB 339, which would have ordered an SCC proceeding to determine whether other customers are subsidizing data centers and to revise the allocation formula, was carried over to 2027. The statutory direction now points toward cost causation, but the binding allocation question this section describes remains open.
The 2022 fuel shock hit every class as the same flat adder. When Russia's invasion of Ukraine pushed natural gas prices higher in mid-2022, Rider A jumped by roughly +1.5 ¢/kWh for every class: +12% on residential's ~12.7 ¢/kWh starting rate, +17% on mid-commercial's ~9.0 ¢, +23% on large-load's ~6.4 ¢. It is the same denominator arithmetic as the July 2026 fuel table above: a uniform ¢/kWh adder hits smaller denominators harder. That is why large-load's percentage growth temporarily caught up to residential's in the chart below, not because the underlying burden was equalizing.

The new GS-5 rate class takes effect January 1, 2027. Approved in Dominion's 2025 biennial review (PUR-2025-00058), GS-5 applies to customers with peak demand of 25 MW or more and at least 75% load factor, a profile that matches most hyperscale data centers. Its terms include 85% minimum billing demand for transmission and distribution, 60% for generation, and 14-year contracts. GS-5 is prospective only, applying to agreements signed on or after that date, so most existing Dominion data centers stay on Schedule GS-3 or GS-4 for years.
What happens after the 14-year contract. In direct testimony filed with the SCC, the Piedmont Environmental Council (an intervenor opposing Dominion in the case), through its expert witness Gregory Abbott, analyzed the depreciation timeline of the $22.4 billion in projected incremental plan cost that Dominion's 2024 IRP attributes to data-center load (its modeled net present value with data centers minus without). The $22.4 billion is forward-looking, not yet spent; the majority of it would be built and rate-based after GS-5 takes effect January 1, 2027, meaning new data-center customers under GS-5 cover the bulk of that capital through the 14-year minimum-billing window. Assuming standard straight-line depreciation over a 36-year asset service life, Abbott calculated that $13.69 billion (61.1%) of that capital would still be undepreciated and unrecovered at the end of the 14-year contract. PEC's counter-proposal of a 20-year contract term would leave $9.96 billion (44%) undepreciated. The SCC's November 2025 final order approved the 14-year term, not PEC's 20-year alternative, so these figures describe the higher-exposure scenario under Abbott's own assumptions (36-year straight-line depreciation), not the regulator's adopted view.
Under standard utility cost-recovery rules, an undepreciated asset that remains in service continues to be recovered from the customer base. After the 14-year minimum-billing window expires in 2041, the cost of the infrastructure built to serve data centers during the contract period would shift to whichever customers are taking service from Dominion at that point. Under the existing class-allocation rules, that means residential customers carry the majority share. Two conditions are necessary for this outcome to apply: anticipated data-center demand must fully materialize during the contract period, and High Load customers must honor their contractual obligations. If either condition breaks (load forecasts miss, customers depart), additional stranded-cost risk falls back on existing customer classes.
The same testimony puts the swing in dollar terms, using figures Dominion produced in the case. Without data-center growth, a typical 2039 residential bill reaches about $242 a month. With it, the outcome ranges from roughly $214 (if the data centers materialize and are allocated their share, spreading fixed costs across more users) to about $315 (the stranded-cost case, where the buildout is incurred but the load does not show up): a swing of about $73 a month set by cost allocation and whether the load is real, not by the data centers themselves. GS-5 moves toward the protective end by assigning more cost to large loads and locking them into minimum charges, but its minimums are partial and apply only to new contracts, so it narrows the downside rather than eliminating it or reaching the best case.
One mechanism for that departure already exists: retail choice. Under Va. Code § 56-577, large customers can buy generation from a competitive supplier (transmission and distribution still come from Dominion), and 2026's HB 921 broadened it to any nonresidential customer above 5 MW; JLARC notes that virtually all planned data centers clear the eligibility thresholds. If they leave in volume, the fixed cost of generation Dominion has already built re-allocates to the customers who stay: Dominion's own estimate is that the shift could exceed $600 million annually, about $150 per year per residential customer if all currently eligible customers, including non-data-center customers, chose to participate in retail choice. JLARC expects the figure to grow substantially as data centers make up a larger share of the customer base. That compounds with JLARC's separate finding that data-center-driven load growth could add $14-$37/month in generation and transmission charges for a typical residential customer by 2040, in 2024 dollars.
Flexibility Gap
A capacity-recovery framework built around stable load growth, with a class-allocation structure set decades ago, is now being applied to the fastest load growth in this system's record.
On a typical Dominion residential bill in June 2026, capital and fixed charges (base rates, grid-expansion riders, clean-energy mandates) account for roughly $139/mo (79% of the bill), while fuel and energy costs account for roughly $33/mo (19%). The commercial and large-load profiles lean the same way, with fixed infrastructure outweighing the commodity, though the exact split differs by class. This is where flexibility has leverage, though only on part of the bill: cutting kilowatt-hours only touches the energy share, while cutting a customer's contribution to system peak hours reduces the demand-driven capacity Dominion has to build (generation and transmission), though not the policy-mandated clean-energy riders, which a peak reduction does not shrink.
Flexibility programs operational or filed in Dominion's territory today, with their reach across customer classes:
- Smart Thermostat Rewards (residential, active): Dominion's bring-your-own-thermostat demand-response program. Customers who enroll a compatible smart thermostat receive a $25 enrollment incentive and $25/year for participating; in exchange, Dominion can dispatch the thermostat (typically by raising the set-point a few degrees) during peak events. Dominion's own event log shows 17 events totaling 50 hours of dispatchable load reduction in 2025. (The legacy switch-based Smart Cooling Rewards program was retired after the 2022 cycling season.)
- Voluntary time-of-use rates (residential): Schedule 1G (the Off-Peak Plan) and Schedule 1EV (EV charging) are SCC-approved tariffs available now, requiring an advanced meter. Schedule 1G was approved as an experimental TOU rate in SCC Case PUR-2019-00214 (May 2020 order), launched in early 2021, and expanded from a 10,000 to 20,000 customer cap in 2023. The 2022 DNV evaluation found 9.4% peak load reduction in summer and 2.9% in winter among the roughly 7,700 retained enrollees in that year's sample. Newer enrollment figures are not publicly disclosed.
- Statutory Virtual Power Plant Pilot (all classes, ramping): Va. Code § 56-585.1:16 (the 2025 Community Energy Act) directs Dominion to operate a VPP pilot of up to 450 MW of aggregated distributed energy resources across residential and C&I customers, with aggregator participation permitted. Dominion filed the pilot tariff at the SCC in December 2025; ramp through August 2026; pilot concludes July 1, 2028. (This sits within the FERC Order 2222 framework that allows distributed resources into PJM capacity and energy markets.)
- Statutory large-load demand-flexibility filing (large C&I, pending): HB 284 / SB 371 (2026, signed) directs Dominion and Appalachian Power to file voluntary demand-flexibility programs for customers with demand of at least 25 MW and an annual load factor of at least 75%, excluding contracted defense facilities, by January 15, 2027 (load-shifting, dynamic voltage and frequency scaling, storage, capacity-reduction credits), with any program incentives designed to avoid unreasonably shifting or imposing participation or administration costs on other customers. Cooperatives follow by 2029. It is the first statutory hook for large-load flexibility in Virginia.
- Large-customer rate structures (commercial and industrial): Schedule MBR (the Market-Based Rate Pilot that passed PJM wholesale rates through to large C&I customers) is no longer accepting new participants. The new GS-5 rate class effective January 1, 2027 introduces minimum demand commitments for customers above 25 MW. BYOG and BYOC arrangements (described in the aside above) are the national pattern for new hyperscale loads; no publicly-confirmed Dominion BYOC tariff structure exists beyond GS-5 today.
- Class-cost-of-service reform that updates the allocation factors deciding who pays for what within the existing capacity-recovery system. GS-5 is one example; deeper reforms (decoupling, performance-based ratemaking) have been adopted by other states but not yet by Virginia.
The metering is deployed; the rate design is not. Dominion's fleet is 99% advanced-metered (2024, EIA-861), so the interval data needed to price peak hours exists. But standard residential service (Schedule 1, about 99% of residential customers) is billed on a fixed customer charge plus seasonally-blocked volumetric energy charges, with no demand ($/kW) charge (the only $/kW component on Schedule 1 is the net-metering standby charge for on-site generation above 15 kW). Seasonally-blocked means the rate varies by season and usage tier, not by time of day, so it carries no peak-hour price signal. Time-of-use is voluntary opt-in only and, as the program list above shows, reaches under 1% of residential customers, leaving the class no individual price signal to shift the peak that drives its allocated cost. Net metering exists (NEM 2.0 was approved in May 2026, though critics say it resembles NEM 1.0), but net metering compensates solar export; it is not demand flexibility.
9.4%
summer peak reduction measured among enrolled time-of-use customers in Dominion's own program evaluation (2.9% in winter)
DNV evaluation of Schedule 1G (2022)<1%
of residential customers are on any time-varying rate; standard Schedule 1 service carries no peak-hour price signal
Schedule 1G enrollment cap (SCC Case PUR-2019-00214); Dominion Schedule 1 rate design
The capex bias is a structural headwind for flexibility. A regulated utility earns a guaranteed return on capital investments but typically does not earn a return on operational solutions like demand flexibility. This is the Averch-Johnson effect documented in regulatory economics since the 1960s: utilities have an incentive to prefer building infrastructure over operating it differently, even when flexibility would be cheaper for customers. Dominion compounds this: it is vertically integrated, owning generation, transmission, and distribution and earning its allowed return (an ROE of 9.8% as approved in the 2025 biennial review, Case No. PUR-2025-00058, up from the prior-period 9.7%) on the capital base of all three, so each megawatt of flexibility that avoids a build shrinks the rate base it earns on. The regulatory reforms that address this directly are decoupling (separating utility revenue from sales volume), performance-based ratemaking (paying utilities for outcomes rather than for capital deployed), and shared-savings mechanisms (utilities keep a portion of the savings flexibility programs deliver). Several states have implemented forms of these reforms; Virginia has adopted neither comprehensive performance-based ratemaking nor revenue decoupling.
A new supply-side mandate, recovered the same way. In 2026 Virginia enacted HB 895 / SB 448 (effective July 1, 2026), directing Dominion to build roughly 16 GW of short-duration and 3.5 GW of long-duration energy storage by 2045. Storage is a flexibility-enabling resource, but the statute procures it as utility-owned capital recovered through a non-bypassable charge on all retail customers, the same socialization mechanism described in Who Pays and Why. And under PJM's marginal ELCC, four-hour storage is accredited well below its nameplate, an accreditation that falls further as more storage is added (a capacity-market construct, not a limit on what a battery can physically deliver), so the nameplate target far exceeds the firm capacity it earns.
Could flexibility fill the gap? Capacity is procured for rare hours, not for the year: Dominion's entire 2025 thermostat season, noted above, came to 50 dispatched hours, and those are the hours the buildout is sized to serve. At pilot scale, the 450 MW VPP cap, if its dispatch proves out, is roughly half the size of the 944 MW Chesterfield peaker, the only new firm generation approved in this study's window. On the data-center side, the Data Centers page covers the evidence: the Duke Nicholas Institute estimates that a 0.5% average annual load-curtailment limit, with curtailment required in an average of 177 hours per year, provides 98 GW of curtailment-enabled headroom across 22 US balancing authorities. The analysis excludes transmission constraints and does not eliminate the need for new peaking capacity or grid expansion. HB 284 now gives Virginia a statutory vehicle for those programs. None of this eliminates building under 5.4%-per-year peak growth. Flexibility does shape how much gets built and when, and whether customers who shift their use are paid for it.
Set the opportunity against what is deployed. The zone's roughly 25 GW peak sits about 9 to 10 GW above its ~15 GW average load, capacity that exists to serve the top hours of the year, with the reserve margin held on top of that (Grid Flexibility, from the peak and average-load figures above). Flexibility competes for the top of that gap. What is operational or planned on the demand side today reaches a small fraction of it: the 450 MW VPP pilot cap is under 2% of the 25 GW peak and about 5% of the peak-to-average gap, and Smart Thermostat Rewards dispatched 50 hours in 2025. The per-customer effect is measured but barely scaled: Dominion's own evaluation found a 9.4% summer peak reduction, among only the roughly 7,700 time-of-use enrollees, while the peak-blind default rate still covers about 99% of residential customers, the class the peak is built for.
The grid Dominion is operating today is more constrained than it was four years ago. PJM's own forecast captures the shift: the 10-year summer peak growth rate for the Dominion zone rose from 2.2% in PJM's 2022 Load Forecast Report to 5.4% in the 2026 report (winter growth rose similarly, from 2.6% to 5.1%). The planning horizon for the projects that would relieve those constraints stretches into the 2030s, and demand has been growing faster than the planning cycle. Among the available tools, demand flexibility operates on both timescales: it can be deployed in months rather than years (immediate years, shaving the peak that drives the buildout now, and it builds toward a grid where customers who move their consumption are paid for it.
The grid must be sized for its coincident peak, and that peak is residential-driven. Dominion's own filings put the data-center load factor at about 92 to 93% (high and steady, not perfectly flat), while non-data-center load runs at 56-58% and the residential class, the peakiest, at about 36 to 41%. As data centers grow they pull the overall system load factor up, from 63% in 2024 toward 72% by 2039, but they add baseload, not peak: the sharp peaks that size the local grid still come from the low-load-factor residential class. That makes households the class with the most peak to shave, even as the system as a whole looks flatter. On average the grid uses only a little over half the capacity it must keep available once the required reserve margin is counted.
Load factors are from Dominion's response to PEC Interrogatory No. 01-16 (PUR-2025-00058): the system load factor rises from 63% in 2024 toward 72% by 2039 with data-center growth, data-center load runs about 92-93% (projected; measured operating values are nearer 79-82%), and non-data-center load 56-58%. The residential class load factor (about 36% in the 2023 biennial review, 40.6% in the 2025 review) is from Dominion class cost-of-service exhibits (SCC Staff witness Glenn Watkins' Schedule GAW-2, PUR-2023-00101; Company witness Robert Miller's Exhibit 25, PUR-2025-00058). The capacity-utilization figure is a Grid Flexibility calculation from DOM-zone load and PJM's reserve requirement.
What to Watch
The next 12-18 months will determine whether current bill pressure stabilizes or intensifies. The milestones, in chronological order:
| When | Milestone | Why it matters for bills |
|---|---|---|
| Jul 1, 2026 | Storage mandate (HB 895 / SB 448) takes effect; Dominion's first storage-procurement filings follow | 19.5 GW of utility-owned storage by 2045 enters rate base, recovered through a non-bypassable charge on every retail customer |
| Jul 14, 2026 | PJM's 2028/2029 Base Residual Auction cleared, the third consecutive year at the price cap | The DOM zone cleared at $325.00/MW-day with no locational adder, down from $333.44 only because the collar's cap itself stepped down; capacity cost keeps feeding base rates at the 2027 biennial review |
| Aug 25, 2026 | Chief Hearing Examiner's report on the July fuel factor and the securitization petition (PUR-2026-00058 and PUR-2026-00078), after the August 11 to 12 hearing | Recommends the interim +$7.97/mo residential rate stand and a seven-year securitization, which would add an estimated $3.05/mo bond charge from early 2027 if the bonds are issued; in the comment round that closed September 1, staff, Dominion, and Consumer Counsel all backed or declined to oppose the seven-year term |
| Sep 3, 2026 | SCC granted Dominion's GS-5 compliance adjustment and dismissed the case (PUR-2025-00058, reopened Aug 25) | Six customers used a 2026 statutory opt-out to stay on GS-4. Dominion moves their revenue and billing determinants from GS-5 to GS-4 and adjusts the GS-4 and GS-5 rates in the compliance filing due at least 45 days before January 1, 2027. Dominion said this leaves the approved revenue requirement and every other class unchanged. Data centers were excluded from the opt-out. Neither respondent opposed |
| Sep 29, 2026 | SCC issued the financing order in the fuel-securitization case (PUR-2026-00078) and the 2026-2027 fuel-factor order (PUR-2026-00058) | The +$7.97/mo fuel step stands. If Dominion issues the bonds, a bond charge follows once they are priced, which Dominion's application expected to begin in early 2027. The fuel-factor case stays open pending Staff's audit of the deferred balance |
| Aug 2026 | Q2 2026 earnings refresh the large-load queue, tracked in PUR-2025-00184 and PUR-2026-00011 | Tests whether the ~70 GW queue and ~10 requests per month keep growing; queue growth feeds the next round of buildout |
| Aug 2026 to Jul 2028 | VPP pilot ramp completes; dispatch performance accrues through the July 1, 2028 conclusion | First measured evidence of whether aggregated DERs can shave Dominion's peak, the quantity that drives residential's allocated share |
| Late 2026 | Next annual IRP update | Refreshes the data-center peak forecast, the $7.6 billion transmission inventory, and the data-center attribution behind it |
| Jan 1, 2027 | GS-5 takes effect; HB 284 large-load flexibility filings due | New 25 MW-plus customers take 14-year minimum-demand commitments; the first statutory flexibility programs arrive for customers 25 MW and above |
| Nov 17, 2026 | Evidentiary hearing on the NextEra acquisition (PUR-2026-00112), with public witness hearings November 5, 9, and 10 | The contested record on the $2.25 billion bill-credit proposal, about $1.78 billion of it Virginia's. Clean Virginia has moved to deem the petition incomplete |
| Early Jan 2027 | Statutory outside date for the SCC to approve or disapprove the merger: 60 days from the July 15 filing, which the Commission extended by the maximum further 120 | Decides whether the bill credits happen at all; FERC and NRC approvals run separately, and the companies expect a 12 to 18 month close |
| 2028-2030s | MARL, Valley North, Chanceford-Doubs, and Heritage-Mosby in-service dates | Import relief lands only if schedules hold; PJM already adds 5.1 GW of DOM data-center demand in the 2027/2028 delivery year alone |
Docket Tracker
Every Virginia SCC proceeding cited in this case study, what it decides, and where it stands. This tracks only the dockets that appear in the analysis above, not all Dominion proceedings; each docket number links to the SCC's official case record.
| Docket | Proceeding | Status |
|---|---|---|
| PUR-2026-00058 | 2026 fuel factor revision. Sets the Rider A fuel rate effective July 1, 2026 for every customer class, covering the 2026/27 fuel year plus a $65.8 million carry from 2024/25. The roughly $1.08 billion projected prior-period balance also includes a 2025/26 deferral of about $1.01 billion, which this rate leaves to the securitization petition. The approved fuel factor raises a 1,000 kWh residential bill by about $7.97/mo; the standard rate (+$21.79/mo) would have applied if the companion securitization petition had been denied. Heard August 11 to 12, 2026, with the Chief Hearing Examiner recommending approval on August 25. On September 29 the Commission approved the 3.7648 cents/kWh factor for usage on and after July 1, 2026. The case stays open: Staff is to audit the deferred fuel balance as of June 30, 2026, with any adjustment made in this case. | pending |
| PUR-2026-00112 | NextEra acquisition of control. Whether NextEra Energy may acquire control of Dominion Energy Virginia. The petitioners' own testimony sets the customer terms: $2.25 billion in shareholder-funded bill credits across the three Dominion states over two years after closing, of which Virginia takes about 79%, or $1.78 billion, apportioned by each state's 2025 electric energy sales, and designed to give a typical 1,000 kWh residential customer $10 a month computed from that customer's own 2026 and 2027 usage. Contested: Clean Virginia moved to deem the petition incomplete, and Sierra Club, Consumer Counsel, the Committee for Fair Utility Rates, the Piedmont Environmental Council, and Appalachian Voices have all entered. Public witness hearings November 5, 9, and 10, 2026; evidentiary hearing November 17, 2026. | pending |
| PUR-2026-00011 | Large-load connection queue standards. Reviews Dominion's proposed connection-queue standards and contract terms for requests serving data-center customers in the DOM Zone at roughly 100 MW or more. Also the docket where Dominion disclosed its roughly 70 GW large-load request queue, the number that sizes the next round of buildout. | pending |
| PUR-2026-00078 | Fuel-cost securitization petition. Decided whether Dominion may securitize the accumulated fuel deferral, which determined which July 2026 fuel factor stands. On September 29, 2026 the Commission approved the petition and authorized deferred fuel cost bonds of up to about $931.85 million (the $922.06 million deferral plus $9.79 million of upfront costs), with a scheduled final payment about seven years after the first bonds are issued. That is the term the Chief Hearing Examiner recommended on August 25. Dominion had sought about ten. The interim fuel rate stands. If Dominion issues the bonds, a residential bond charge follows once they are priced. The order sets no monthly figure; Dominion's petition estimated $3.05/mo on a seven-year bond. Financing Order issued September 29, 2026, approving the petition. | decided |
| PUR-2025-00184 | 2025 Integrated Resource Plan Update. SCC review of Dominion's annual update to the 2024 IRP. Together with the 2024 plan it carries the roughly 9 GW ten-year data-center peak forecast and the 203-project, $7.6 billion transmission inventory whose data-center-driven projects are recovered through Rider T1 and base transmission rates. Final order issued December 23, 2025. | decided |
| PUR-2025-00058 | 2025 biennial review of base rates. Set Dominion's base rates for January 1, 2026 through December 31, 2027, the visible final step upward on bills in early 2026 (about +$11/mo for a typical residential customer: the order states +$11.24/mo, our Schedule 1 reconstruction +$11.14/mo). Also created the GS-5 rate class for loads of 25 MW and up at high load factor, effective January 2027, which governs how future data-center customers pay. Reopened August 25, 2026 for one limited question: six customers used a 2026 statutory opt-out to stay on GS-4. On September 3 the Commission granted Dominion's motion to move their revenue between the two classes in the compliance filing, which Dominion said leaves the approved revenue requirement unchanged. The opt-out excludes data storage, so it does not reach data centers. Final order issued November 25, 2025; reopened August 25, 2026 for a limited GS-5 compliance adjustment, granted September 3, 2026 (case dismissed). | decided |
| PUR-2025-00076 | Rider T1 transmission cost recovery, 2025. Dominion's annual transmission rate adjustment for the September 2025 to August 2026 rate year. Its workpapers are the source for the class allocation cited above: of the $1.343 billion transmission revenue requirement, residential is assigned about $648 million, roughly 48% of the cost against about 35% of the energy, the highest per-kWh transmission rate of any class. Final order issued August 1, 2025; rates effective September 1, 2025. | decided |
| PUR-2024-00184 | 2024 Integrated Resource Plan. Dominion's long-range resource plan proceeding. With its 2025 Update it is the source for the data-center demand forecast and the transmission project inventory cited throughout this case study. Final order issued July 15, 2025. | decided |
| PUR-2020-00092 | Microsoft petition on GS-4 minimum charges. Microsoft's petition challenging Dominion's minimum-charge provisions for large customers, and the public confirmation that hyperscale loads take service under Schedule GS-4 today. Denied without prejudice by order of February 1, 2021. | decided |
| PUR-2019-00214 | Schedule 1G residential time-of-use rate. Approved Schedule 1G, Dominion's voluntary experimental time-of-use rate and the only peak-hour price signal available to residential customers. Launched in early 2021; the enrollment cap was expanded from 10,000 to 20,000 customers in 2023. Final order approving the experiment issued May 20, 2020. | decided |
Statuses verified between June 10, 2026 and October 1, 2026 against the Virginia SCC docket search.
Methodology
Sources
Every dollar figure in this case study was reconstructed from Virginia State Corporation Commission tariff filings, with additional context from PJM Interconnection reports, Federal Energy Regulatory Commission orders, the Joint Legislative Audit and Review Commission's 2024 data-center study, and Piedmont Environmental Council expert testimony. Each Dominion rate component (base rates, the fuel factor, and the 15 active rate adjustment clauses) was traced to a specific SCC docket: for every rider, the approved cents-per-kilowatt-hour value, effective period, legal authority, and underlying revenue requirement come from the filing record. Original PDF filings are preserved with cryptographic checksums so that any future change to a primary source can be detected.
Calculation
Bills were reconstructed for three representative customer profiles month by month from June 2022 through June 2026: residential at 1,000 kWh per month (Schedule 1); mid-commercial at 30 MWh per month with a 75 kW peak (Schedule GS-2, mid-market); large-load at 8 GWh per month with a 15 MW peak (Schedule GS-4, transmission voltage). Each monthly bill sums every approved per-kWh tariff component (base generation, transmission, distribution, customer charge, fuel factor, and all active rider charges). State and local taxes and fee assessments are an unmodeled line item, which produces a small gap between the reconstructed tariff stack and the customer's total bill. The headline class-growth figures (residential +38%, mid-commercial +36%, large-load +34%) and the 17.6 versus 8.5 cents-per-kWh comparison are reported on this complete-bill basis (base, fuel, and all riders), not a single rider or the narrower tariff-stack subset. The window starts in June 2022, just after the one-time 2022 commodity (Russia-Ukraine) fuel spike, to isolate the buildout-era trajectory from that spike.
One scope note. The “clean energy mandates” bucket appears small at the start of the window because most of the explicit clean-energy riders were authorized under Virginia's 2020 Clean Economy Act and ramped onto bills beginning in late 2021. Pre-VCEA renewable compliance costs sat inside base generation rates and were progressively reclassified into the explicit clean-energy bucket as the new riders came online. The chart reflects what appeared on a customer's bill statement; the magnitude of post-2022 growth still primarily reflects real new buildout costs (offshore wind, utility-scale solar, small-modular-reactor pre-development).
Validation
The reconstruction was cross-validated against two independent anchors: (1) EIA Form 861 annual realized revenue per customer class for Dominion, 2018-2023; and (2) the SCC Voluntary Electric Utility Regulation annual typical-bill reports. Both anchors agreed with the tariff-stack reconstruction within the modeled scope. The 2023 SCC typical-bill figure was $129.01/mo for residential 1,000 kWh (a 2023 anchor, not a current bill); the tariff-stack reconstruction (the narrower subset, excluding taxes and fees) averaged $117.86/mo over that same 2023 window, with the difference consistent with the unmodeled taxes and fee assessments noted above. The current complete-bill headline ($175.98/mo in June 2026, up from about $127/mo in June 2022) sits above the 2023 anchors because of post-2023 rider growth. The full source-document inventory, extraction code, per-month component dataset, and chart-rendering scripts are available on request pending publication of the project repository.