Briefing · PJM
PJM 2028/29 Capacity BRA: Cleared at Its Cap for a Third Straight Year
PJM's capacity auction for the 2028/2029 delivery year cleared at $325.00 per MW-day (UCAP) on July 14, 2026, its FERC-approved ceiling, for the third year running. The price is nominally below last year's $333.44 cap, which hides the pressure underneath. PJM procured more capacity than a year earlier and still landed below its own reliability target. Demand is outrunning supply due to large-load growth.
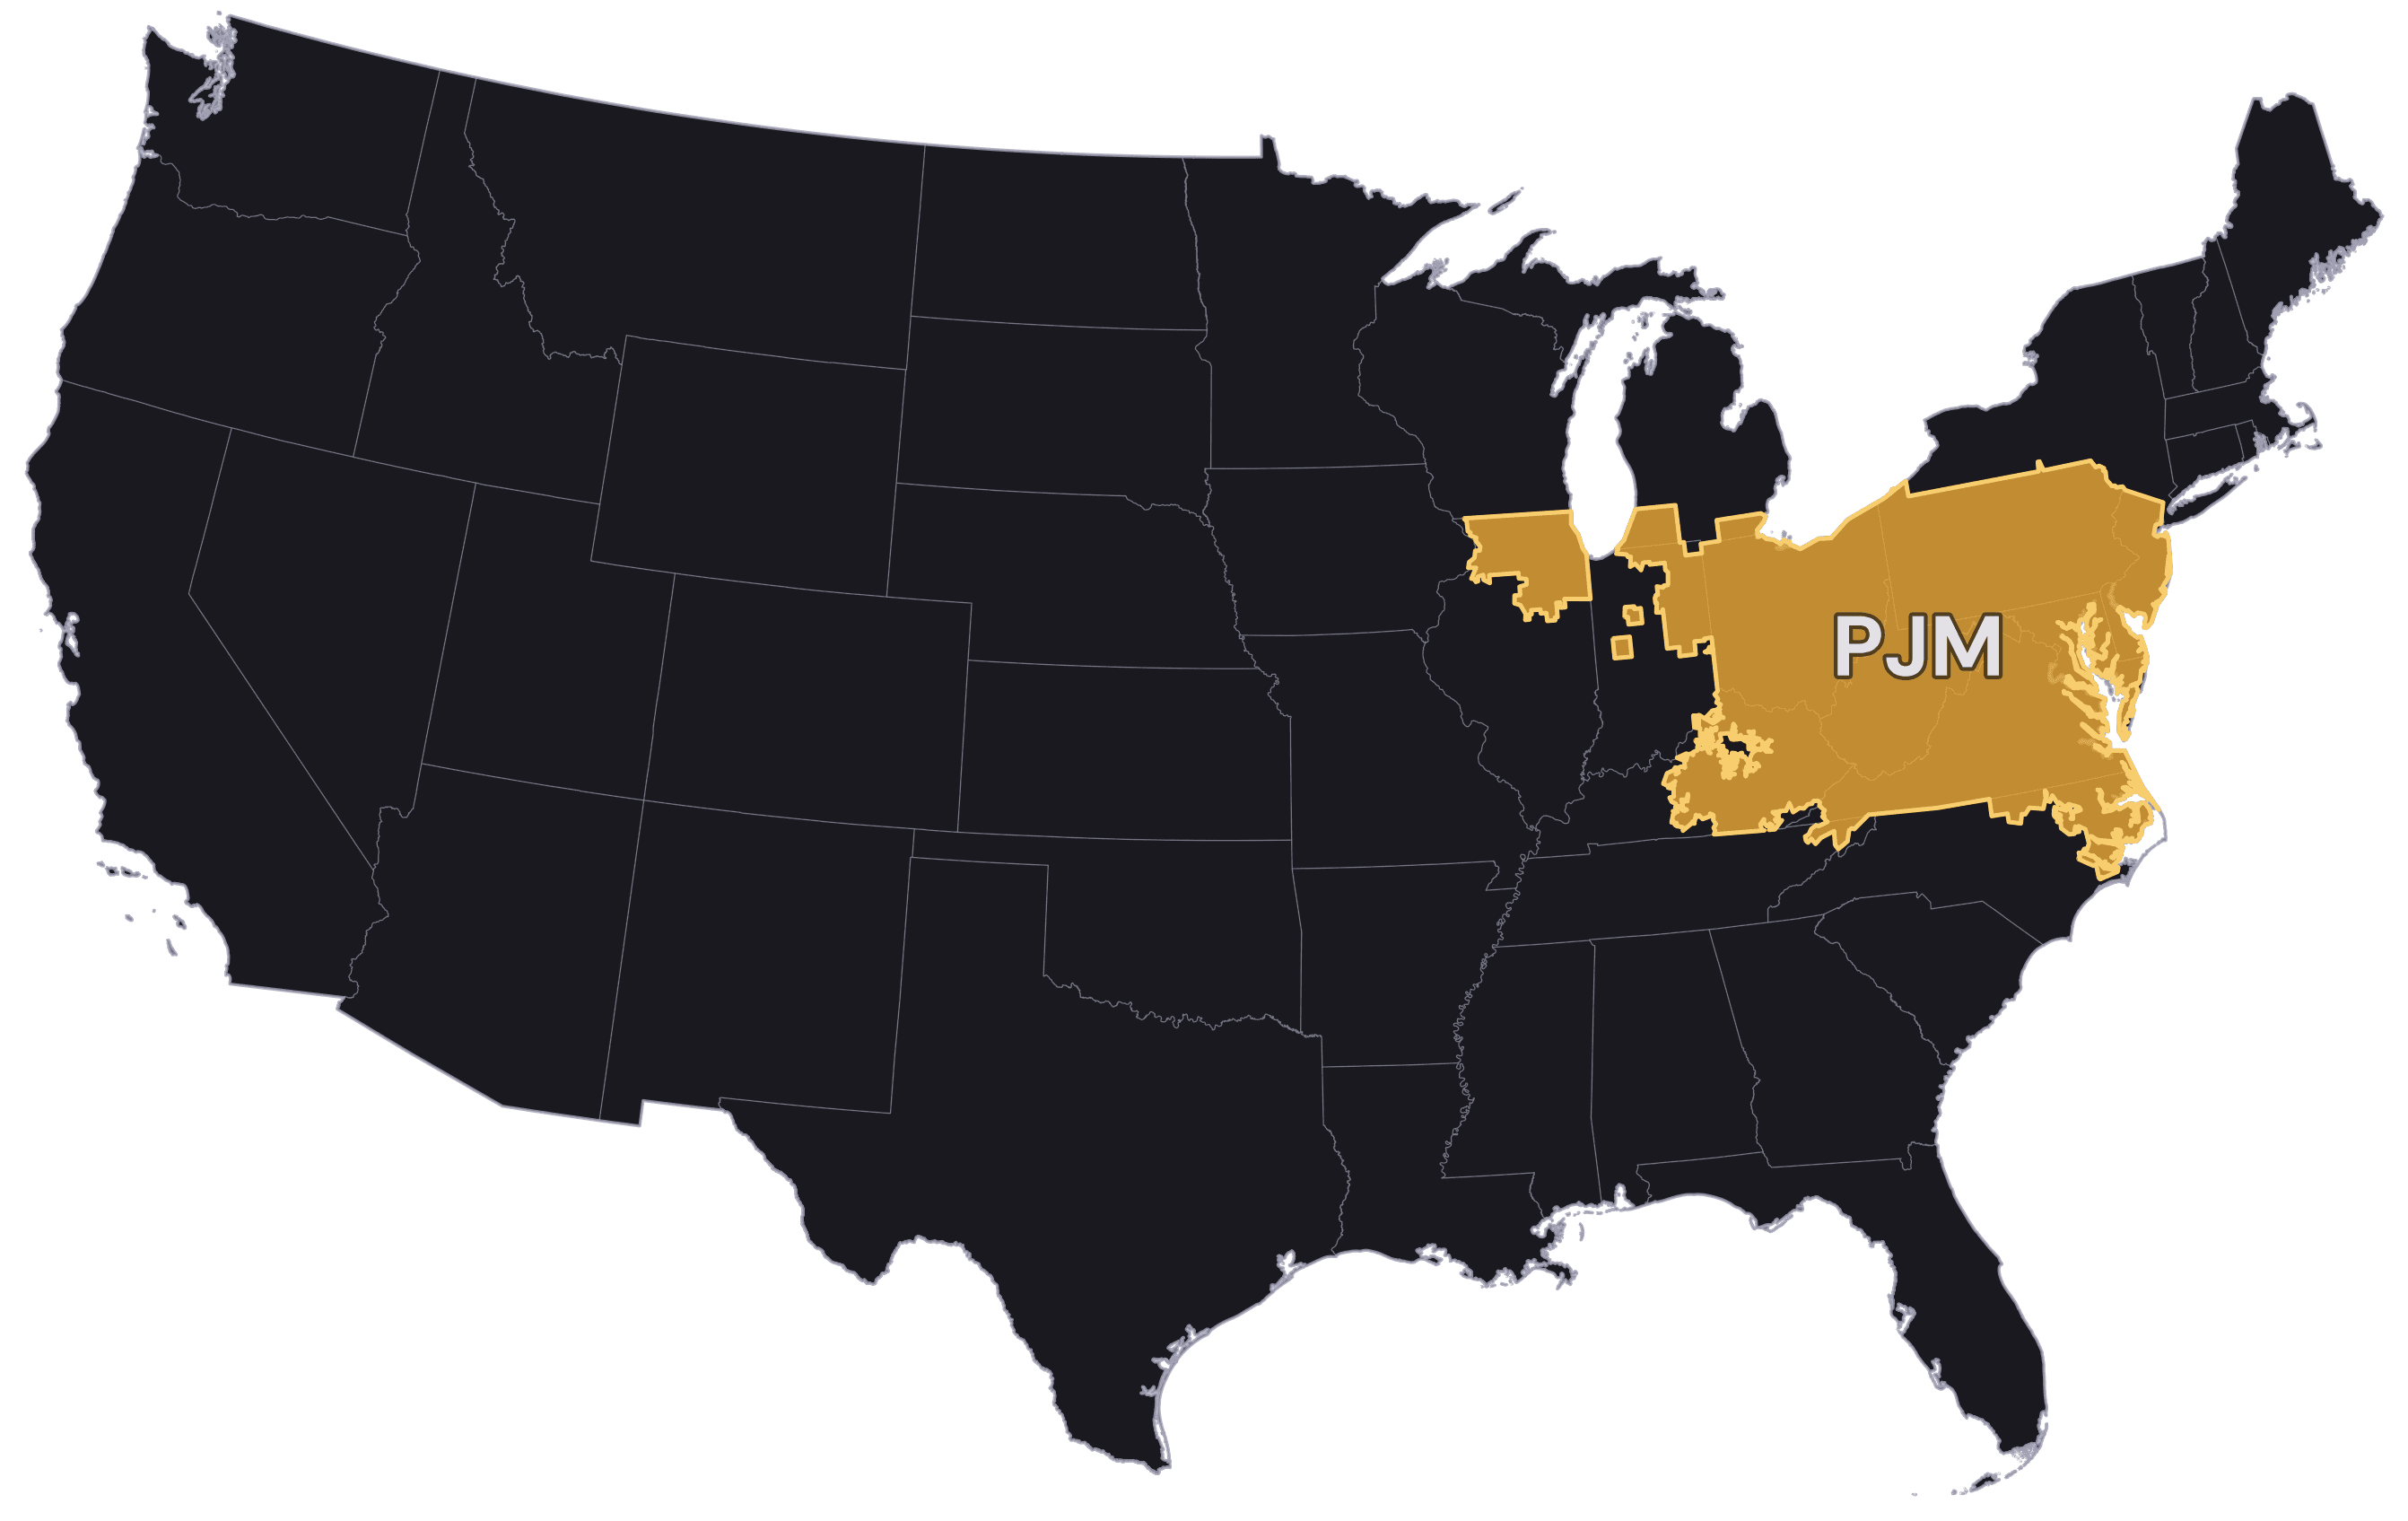
The result also points to a demand-side answer that needs no new power plants. Demand response, a commitment to cut load when the grid is tight, already clears as capacity in this auction. This piece reads the auction for what it means for grid flexibility. A companion case study looks at how the grid held up when a July 2026 heat wave, two weeks before, pushed PJM to an all-time peak.
Key takeaways
- PJM's 2028/2029 auction cleared 138,318 MW at $325.00/MW-day, the FERC-approved price ceiling, for a third straight year. The ceiling stepped down 2.5% from 2027/28's $333.44, but the auction still cleared right at it.
- Every PJM zone cleared at the RTO-wide price this year. The collar has bound every zone since 2026/27, ending the locational premiums DOM and BGE paid in 2025/26. The zone that would bind without the collar still shifts year to year (ComEd in this year's simulation, Dominion in 2027/28's), even though the collar equalizes the actual price. PJM's estimated total reserve margin (14.7%) sits 5.3 points below its 20% target, the second straight auction more than five points short.
- Demand response cleared 7,017 MW (about 5% of the total). In PJM Table 6's season-summed RPM-plus-FRR accounting, a wider basis, DR totaled 7,364.7 MW versus 6,006.7 MW for wind, solar, and battery/hybrid combined (annual plus separately-counted summer and winter commitments). Two newer, more residential-reachable pathways (aggregated distributed resources, price-responsive demand) drew zero offers this year.
- PJM's own same-offer simulation puts this auction's price without the collar at $554.72/MW-day, 71% higher, the largest gap in three years of the same simulation. The actual capped clearing price can enter load-serving entities' capacity obligations and later retail rates; PJM's simulation does not. The amount and lag vary by contract, FRR status, utility, and state, as Grid Flexibility's Dominion Virginia case study shows for one state.
Auction Mechanics
PJM runs its Base Residual Auction (BRA) to line up enough generation and demand-side capacity to cover the grid's peak, with a reliability margin, years before the delivery year arrives (nominally three years out, though this cycle and the one before it ran on a compressed 23-month schedule). The auction clears at a single RTO-wide price per MW-day of Unforced Capacity (UCAP, PJM's term for the reliability-accredited portion of a resource's capacity after PJM's applicable ELCC or performance method), with narrower zones (Locational Deliverability Areas, or LDAs) paying more only when they cannot import enough capacity from neighbors.
The Pattern
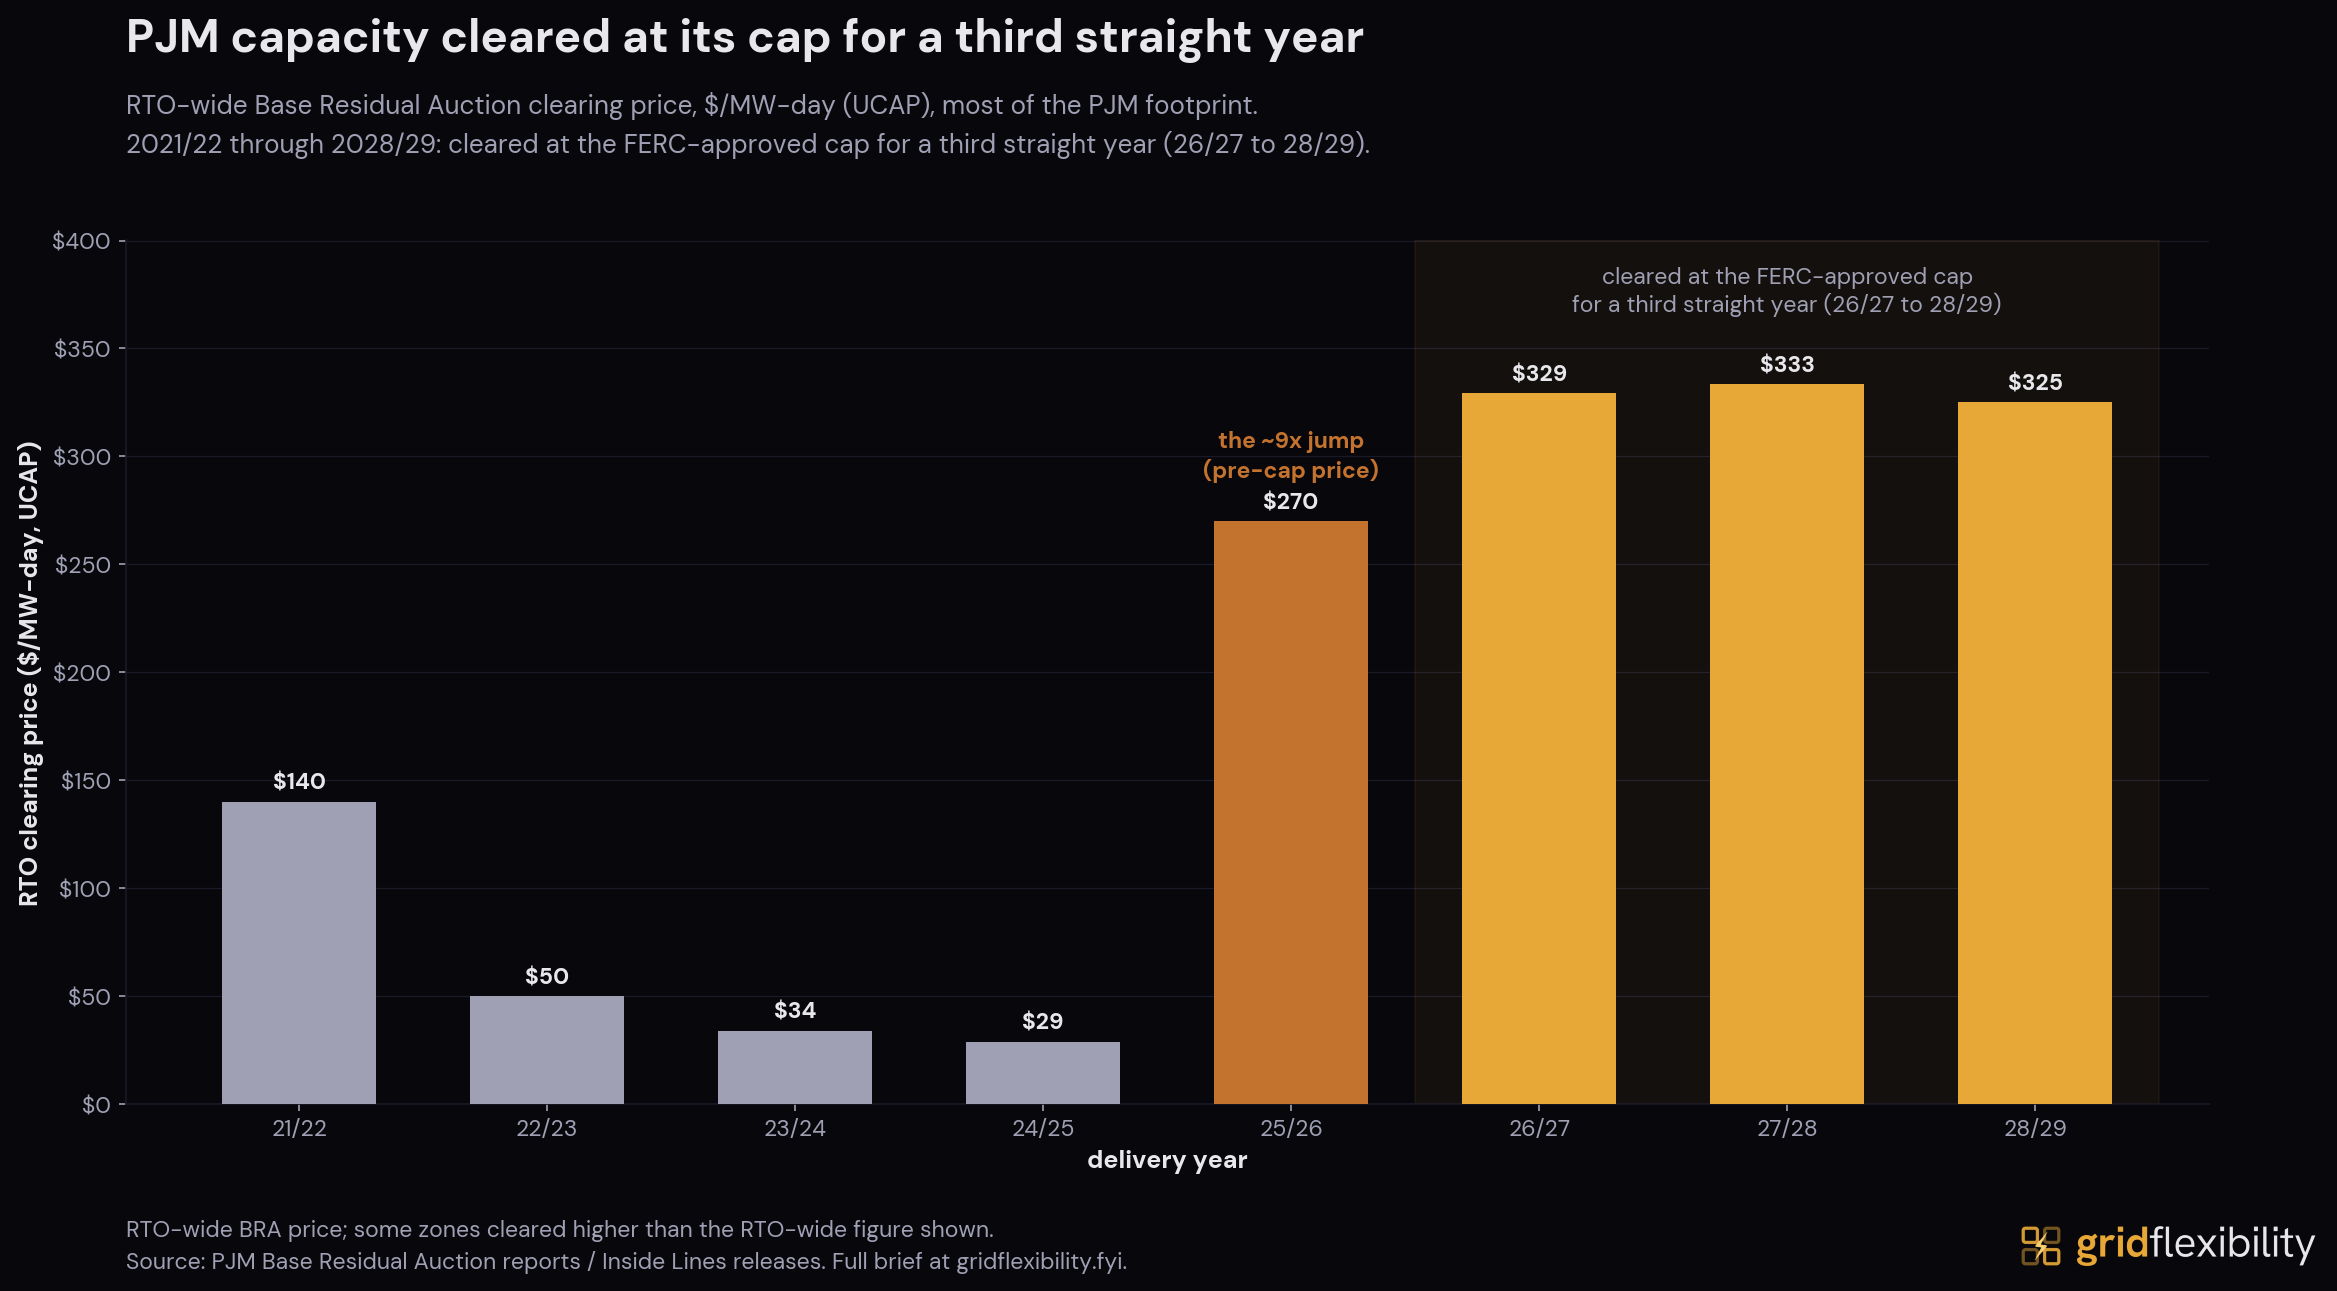
RTO-wide Base Residual Auction clearing price by delivery year, $/MW-day (UCAP). Source: PJM 2028/2029 BRA results and prior-year BRA reports.
The RTO-wide price fell across four straight auctions, from $140.00 (2021/22) to a low of $28.92 (2024/25), before jumping to $269.92 for 2025/26. PJM attributed that roughly 9.3-fold increase to generator retirements, a higher load forecast, and reforms to how it accredits intermittent and storage resources for reliability (ELCC). A price collar negotiated after the jump (below) has bound every auction since: $329.17 for 2026/27, $333.44 for 2027/28, and now $325.00 for 2028/29, lower only because the collar's own ceiling moved down. Every price shown, including this year's, cleared at that ceiling.
Since the collar took effect for 2026/27, it has capped every PJM zone. All zones cleared at the same $325.00 this year, with no locational premium possible. In 2025/26, the last uncapped result, both Dominion (DOM) and BGE cleared above the $269.92 RTO-wide price, DOM at $444.26 and BGE at $466.35. DOM has now cleared at the RTO-wide price for three straight auctions, the same as every other zone.
Price Collar
The collar is not a market outcome. It originated in a complaint Pennsylvania Governor Josh Shapiro filed with FERC (Docket EL25-46) after the 2025/26 jump, which PJM answered with its own Section 205 filing (ER25-1357) proposing a temporary cap and floor. FERC accepted the collar for 2026/27 and 2027/28, then extended it to 2028/29 and 2029/30 (Docket ER26-1556, accepted 2026-04-28). This auction's collar set a ceiling of $325.00 and floor of $175.00 per MW-day UCAP.
PJM's own report appendix reruns each auction's offers through the uncapped VRR curve to show where they clear without the collar, a same-offer simulation PJM has now published for three straight auctions on the offers as submitted, not a prediction of how sellers would have bid without a cap. For 2028/29, it clears at $554.72 per MW-day, 71% above the actual result. On PJM's price-times-cleared-MW metric, that simulation implies $29.7 billion against the $16.4 billion actually cleared. This same-offer simulation gap has grown every year the collar has been in place:
| Delivery year | Actual, with collar | PJM same-offer simulation without the collar | Increase in PJM's price-times-cleared-MW metric |
|---|---|---|---|
| 2026/27 | $329.17/MW-day | $388.57/MW-day | +$2.9 billion |
| 2027/28 | $333.44/MW-day | $529.80/MW-day | +$9.9 billion |
| 2028/29 | $325.00/MW-day | $554.72/MW-day | +$13.3 billion |
- Actual, with collar
- $329.17/MW-day
- PJM same-offer simulation without the collar
- $388.57/MW-day
- Increase in PJM's price-times-cleared-MW metric
- +$2.9 billion
- Actual, with collar
- $333.44/MW-day
- PJM same-offer simulation without the collar
- $529.80/MW-day
- Increase in PJM's price-times-cleared-MW metric
- +$9.9 billion
- Actual, with collar
- $325.00/MW-day
- PJM same-offer simulation without the collar
- $554.72/MW-day
- Increase in PJM's price-times-cleared-MW metric
- +$13.3 billion
In the 2028/29 simulation, Dominion's zone tracked the RTO-wide price. The one zone that would have cleared higher was ComEd, at $776.69, a reversal from 2027/28, where DOM was the constrained zone at $542.83. In reality, under the collar, ComEd cleared at the same $325.00 as every other zone. Without the collar, DOM also clears at the $554.72 RTO price, above the $325 cap but below ComEd's $776.69 locational result.
Demand Pressure
PJM reports several changes behind the higher Reliability Requirement and the remaining reserve shortfall.
Load growth is the clearest demand-side tightener. This year's Reliability Requirement, the RTO-wide capacity target PJM sets before each auction, rose 3,613 MW (152,400 to 156,013 MW UCAP). PJM says the 1,374.5 MW forecast-load increase was largely due to additional Large Loads. Separately, PJM's 2025 long-term forecast projects that data centers account for about 30 of 32 GW of peak-load growth from 2024 to 2030. The remainder of the Reliability Requirement increase reflects a planning-parameter update (the Forecast Pool Requirement rose from 0.926 to 0.9401), not new load.
New physical supply is not keeping pace. RPM offers rose 3,447.0 MW UCAP (136,147.6 to 139,594.6 MW), but only 524.7 MW was new generation and uprates. Cleared RPM capacity rose 3,733.2 MW UCAP (134,584.6 to 138,317.8 MW), mainly from higher Accredited UCAP factors and fewer unoffered megawatts, PJM says, not new steel. Fuel mix shifted underneath that total too. Coal's exit tightened one segment, but gas and accreditation more than offset it (fuel-by-fuel detail in the Resource Mix and Storage section, below).
Interconnection-queue attrition is one more factor. PJM's market monitor estimates that 23,685.3 MW of legacy-queue interconnection requests (active, suspended, or under construction as of March 31, 2026) become 3,859.2 MW (16.3%) after historical completion rates and this auction's ELCC derates, evidence of pipeline attrition, not a BRA counterfactual.
Total procured capacity, across the auction and the utilities that self-supply outside it (Fixed Resource Requirement, or FRR, entities), came in at 149,181.6 MW, including the 138,318 MW cleared in the auction itself. That is 6,831.3 MW below the 156,013 MW target. PJM frames the shortfall as, in the report's words, “slimmer reserves and greater level of risk,” not system failure.
The total reserve margin, including FRR capacity, was an estimated 14.7% (PJM's own figures), 5.3 percentage points below PJM's 20% target (8,716.1 MW ICAP short). That is the second straight auction more than five points below target. 2027/28 procured a 14.9% total margin, 5.1 points below 20%. A narrower cross-check, the RPM-only margin excluding FRR, was 14.4% in both years, a different basis than the all-in total.
PJM's CEO, David Mills, put it plainly: “demand for electricity continues to grow faster than electricity supply,” a system-wide observation, not an attribution for this auction's specific price.
Demand Response
Each cleared DR megawatt meets one megawatt of PJM's capacity requirement with a committed load reduction rather than generation. PJM ran this auction, like the one before it, on the same compressed 23-month schedule described above, leaving new generation less runway than usual to respond to the price signal.
Demand response cleared 7,017 MW in the 2028/29 auction (UCAP), about 5.1% of the 138,318 MW total (PJM's 2028/29 results, Tables 5 and 9). That is down slightly (about 4%) from 7,299 MW in 2027/28, but still 27% above the 5,531 MW that cleared in the 2026/27 base auction, the year demand response carried its lowest base-auction accreditation rating (69%, down from 76% for 2025/26). The rating rose to 92% for 2027/28 and is 91% for 2028/29.
Not every flexibility pathway showed up this year under its own name. Order 2222, the FERC rule letting aggregated distributed resources (rooftop solar, batteries, smart thermostats, bundled by a third party) bid into capacity markets, was eligible in a PJM BRA for the first time this year and drew zero offers. PJM's Order 2222 compliance proceeding (FERC Docket ER22-962) does not reach full implementation until February 1, 2028. This auction offered only earlier eligibility, ahead of the full model's membership, utility-review, and telemetry requirements. Price-responsive demand, a separate and narrower product tied to an hourly-changing retail rate or real-time LMP, also drew zero offers. It reduces the capacity PJM buys rather than clearing as a paid resource of its own. Neither zero means distributed or price-responsive assets are absent from PJM. A qualifying battery, aggregation, or curtailable load can already clear capacity under PJM's generator, Capacity Storage Resource, hybrid, or demand-response models, and one location cannot double-count across them. Today's demand-side capacity is mostly the older, curtailment-style kind (industrial and commercial load paid to cut back, dispatched through PJM or a curtailment service provider). The new aggregation pathway drew no first-auction offers before its full implementation. PJM's narrower retail-price-response product drew none either.
The base auction is not PJM's last word on 2028/29. Before the June 2028 delivery start, PJM holds two more incremental auctions that adjust the position as its forecast and fleet change, in July 2027 and February 2028. The February auction falls after Order 2222's full model takes effect, so a qualified aggregation could offer capacity there too. But these are openings, not outcomes. PJM has not reported that any pathway that offered zero this year will use them, and an incremental auction can narrow the shortfall this auction left, though not necessarily close it. In the two most recent completed delivery years, incremental auctions added only about 180 to 200 MW of demand response on top of the base auction, roughly 3 percent (the market monitor's 2026 Q1 State of the Market report).
Resource Mix and Storage
PJM pays for accredited, year-round reliability, not nameplate megawatts. Storage and flexible load count as capacity only through a qualifying pathway, and storage's pathway is not demand response.
A front-of-meter battery clears the BRA as a Capacity Storage Resource, committed to the same all-year Capacity Performance obligation as a gas plant and accredited through PJM's ELCC framework. A behind-the-meter battery can instead register as demand response or under the DER aggregation model when its configuration and retail rules qualify, but the same location cannot double-count across models.
Battery and hybrid resources cleared 478.3 MW UCAP this year, on a combined RPM-plus-FRR basis (PJM does not publish a BRA-only battery subtotal), up 273 MW from 2027/28. Accreditation moved in storage's favor. The 4-hour rating rose from 58% in 2027/28 to 59% this year, a one-point move. A separate, explicitly non-binding PJM projection shows that rating falling to 23% by 2035/36 as the assumed fleet mix changes further out, a prospective scenario, not this year's accreditation.
The same auctions shifted the fleet underneath storage from coal toward gas. The table below breaks out the cleared mix by fuel, on PJM's Table 6 RPM-plus-FRR basis:
| Fuel | Cleared UCAP, 2028/29 (MW) | YoY change (MW UCAP) | ELCC (PJM class rating; * = fleet-weighted proxy) |
|---|---|---|---|
| Gas | 68,272.9 | +5,639 | ~75%* |
| Nuclear | 30,677.6 | +125 | 96% |
| Coal | 26,825.4 | -2,941 | 85% |
| Demand response (ELCC class: Demand Resource) | 7,364.7 | -277 | 91% |
| Hydro (PJM Table 6: Water) | 6,033.9 | +32 | - |
| Wind | 3,412.6 | -114 | ~34%* |
| Solar | 2,115.8 | +651 | ~9%* |
| Battery/hybrid | 478.3 | +273 | 59% |
- Cleared UCAP, 2028/29 (MW)
- 68,272.9
- YoY change (MW UCAP)
- +5,639
- ELCC (PJM class rating; * = fleet-weighted proxy)
- ~75%*
- Cleared UCAP, 2028/29 (MW)
- 30,677.6
- YoY change (MW UCAP)
- +125
- ELCC (PJM class rating; * = fleet-weighted proxy)
- 96%
- Cleared UCAP, 2028/29 (MW)
- 26,825.4
- YoY change (MW UCAP)
- -2,941
- ELCC (PJM class rating; * = fleet-weighted proxy)
- 85%
- Cleared UCAP, 2028/29 (MW)
- 7,364.7
- YoY change (MW UCAP)
- -277
- ELCC (PJM class rating; * = fleet-weighted proxy)
- 91%
- Cleared UCAP, 2028/29 (MW)
- 6,033.9
- YoY change (MW UCAP)
- +32
- ELCC (PJM class rating; * = fleet-weighted proxy)
- -
- Cleared UCAP, 2028/29 (MW)
- 3,412.6
- YoY change (MW UCAP)
- -114
- ELCC (PJM class rating; * = fleet-weighted proxy)
- ~34%*
- Cleared UCAP, 2028/29 (MW)
- 2,115.8
- YoY change (MW UCAP)
- +651
- ELCC (PJM class rating; * = fleet-weighted proxy)
- ~9%*
- Cleared UCAP, 2028/29 (MW)
- 478.3
- YoY change (MW UCAP)
- +273
- ELCC (PJM class rating; * = fleet-weighted proxy)
- 59%
Levels and year-over-year change are PJM Table 6 (RPM plus FRR), which sums annual, summer, and winter commitments separately and is not renormalized to the report's annual-equivalent procurement total used elsewhere in this article. Unstarred ELCC values are PJM's own published class ratings. Starred (*) values are this analysis's fleet-weighted approximations: PJM's published sub-class ratings weighted by each technology's share of PJM's operating fleet in public EIA data, an external proxy, not a PJM-published fleet rating. Sub-class ratings used: gas combined cycle 78%, combustion turbine 67%, combustion turbine dual fuel 79%; wind onshore 34%, offshore 60%; solar fixed-tilt 7%, tracking 10%; hydro intermittent 35% (hydro's other class, non-pumped storage, carries no published rating, so the row is left blank).
Gas offset coal's exit. In PJM Table 6's season-summed RPM-plus-FRR accounting, DR totaled 7,364.7 MW versus 6,006.7 MW for wind, solar, and battery/hybrid combined. That table counts summer- and winter-period commitments separately and is not PJM's annual-equivalent procured total. FRR utilities, which self-supply capacity outside the BRA rather than buying at the RTO clearing price, committed 10,863.8 MW UCAP this year on top of what the auction cleared.
Who Pays and Why
PJM does not bill a household. It charges each load-serving entity a Locational Reliability Charge, the entity's daily UCAP obligation times its zone's final capacity price, calculated daily and billed weekly through the delivery year. From there, more than 67 million people across 13 states and the District of Columbia see that cost on different schedules. PJM's tariff stops at the load-serving entity, and each state's retail rules take over from there.
Pennsylvania's utilities update their default Price to Compare twice a year, bundling capacity into that generation rate. Illinois's ComEd embeds it in the default Electricity Supply Charge, or as a separate Capacity Charge for Hourly Pricing customers, updated each June. Maryland's BGE recovers it through Standard Offer Service bought in four staggered auctions over two years (each covering about a quarter of need) plus a Rider 8 true-up, so the lag spreads across customer cohorts. New Jersey's BGS buys capacity in three-year tranches. Ohio's AEP Ohio carries it in a bypassable Generation Capacity Rider. A competitive supplier prices it into its own contract instead. The mechanism is the same in every state. The recovery path, lag, and bill-line visibility are not. Exposure also varies with each utility's hedges and FRR election. The $16.4 billion this auction cleared (price times cleared quantity) is not the total cost of capacity to PJM's load, since bilateral contracts, self-supply, and FRR utilities are not exposed to the clearing price.
Virginia's Dominion is one worked example, not the general case. For residential customers (Schedule 1), Dominion recovers capacity cost inside a volumetric base generation charge, the same per-kWh rate that covers everything else the utility burns or buys. Larger commercial and industrial customers, on schedules like GS-4, pay part of that same generation charge, capacity cost bundled in, through a demand charge (dollars per kW of billed demand) instead. Either way, the cost reaches the bill only after the utility's next base-rate case, typically a year or more later. Virginia Commission Staff already quantified the residential effect once. Staff modeled 2026 using $444.26/MW-day through May and $329.17 from June, and modeled 2027 at $329.17. On that blended calendar-year basis, Table 4 reports total purchased-capacity bill levels of $4.37 and $5.66 per month for a 1,000 kWh residential customer (Ex. 89, Carol Myers Staff Direct, PUR-2025-00058). The same large-load growth behind this auction's demand pressure runs forward in Dominion's territory, where JLARC projects data-center-driven load growth could add $14 to $37 a month to a typical residential bill by 2040. The full bill reconstruction is at Grid Flexibility's Dominion Virginia case study.
What to Watch
This auction is a forward transaction. It prices the promise that a given megawatt will be there when the system needs it, nominally three years out (two, this cycle). A heat wave is the moment that promise gets collected on, for whichever delivery year's fleet is on the hook at the time. Two weeks before this auction posted, an early-July 2026 heat wave pushed PJM's system demand to an all-time peak. The July 2026 event tested PJM's then-current delivery-year fleet (2026/27), not the 2028/2029 commitments reported here.
A companion Grid Flexibility case study (forthcoming) puts the auction and the event side by side: how PJM's then-current delivery-year fleet, including its committed demand response, performed when called, how the Dominion zone (a locational outlier as recently as 2025/26, above) held up under its own peak, and what any gap implies about accreditation, set against the direction this auction's 2028/2029 procurement is heading. Those figures are still moving through PJM's own metered-performance evaluation, a process that can run for months past the event. Look for it on the Case Studies page.
Pricing Flexibility
Flexibility does not need a new market to prove its value here. It already clears in this one, at the same $325.00 per MW-day as new generation. Where flexibility does show up (curtailment-style demand response, mostly industrial and commercial, plus storage through its own Capacity Storage Resource pathway), it competes directly with new supply on price. Where it has not yet shown up under its own name (aggregated distributed resources under Order 2222, price-responsive retail demand), the eligibility is real, but the first-auction participation is not, and the underlying assets may already clear through another PJM model. Both newer categories drew zero direct offers this year. The zero-offer result shows no direct participation under those two product labels in this auction; it does not quantify available demand-side potential.
Methodology
Sources
Auction results (clearing prices, reserve margins, resource mix, and the uncapped-simulation appendix) come from PJM's own 2028/2029 BRA Results Report and results workbook, published July 14, 2026. Historical prices and the prior two years' own same-offer, without-collar simulations come from the corresponding 2026/2027 and 2027/2028 BRA reports. Interconnection-queue attrition is Monitoring Analytics' own modeled estimate (PJM's independent market monitor, not PJM itself). Storage ELCC ratings, Order 2222/PRD rules, the Locational Reliability Charge mechanism, and the state bill-recovery detail are drawn from PJM's manuals, tariff, and compliance filings, or each utility's own tariff or regulator page. Fleet-mix weighting in the storage fuel-mix table uses EIA's published generator data. The Dominion bill figures and the JLARC projection are reused from Grid Flexibility's Dominion Virginia case study, which sources them independently.
Definitions: UCAP versus ICAP
ICAP (Installed Capacity) is a resource's physical summer capability, bounded by its capacity interconnection rights. UCAP (Unforced Capacity) is the reliability-accredited portion PJM can count toward its requirement. It equals ICAP multiplied by the resource's Accredited UCAP Factor, which PJM derives by resource class using ELCC and performance methods. The auction prices UCAP, not ICAP, so that unlike resources (a gas plant, a battery, a curtailable factory) are compared by expected reliability contribution rather than by nameplate. ICAP remains the relevant figure for physical capability, interconnection rights, and PJM's Installed Reserve Margin target. UCAP is the quantity PJM actually procures and prices.
Calculation notes
Demand-response and resource-mix figures are PJM's own reported totals, not independently modeled. The approximately 5% demand-response figure divides cleared DR (7,017.4 MW UCAP) by total cleared UCAP (138,317.8 MW), the auction-only RPM basis. The wind-solar-battery comparison and the fuel-mix table (cleared UCAP levels and year-over-year changes) use PJM's Table 6, a wider and differently-accounted basis: Table 6 adds FRR self-supply to RPM and sums annual, summer-period, and winter-period commitments separately, so its 149,843 MW season-summed total is about 661 MW above this report's 149,181.6 MW annual-equivalent RPM-plus-FRR procurement total used elsewhere in this article. Table 6's own reported levels are shown as PJM publishes them, not renormalized to the annual-equivalent basis. None of these bases is netted against another. The reserve-margin figures use two distinct PJM-stated bases this article does not blend. The all-in total (RPM plus FRR) is 14.7% for 2028/29 and 14.9% for 2027/28. A narrower RPM-only cross-check is 14.4% in both years. The “second straight auction” framing uses the all-in basis only.