Case Study · California (CAISO)
Southern California Edison: The Storage Boom and the Demand-Side Opportunity
Between 2020 and 2026, California scaled the largest battery fleet in the United States from about half a gigawatt to roughly 15, a nearly thirtyfold buildout in six years. The state ordered the fleet into existence, paid it for capacity, and helped finance the construction.
The same grid has a second flexibility resource that has not received the same treatment. The demand side (homes, home batteries, EVs, smart devices) is metered, price-signaled, and market-eligible, and almost none of it has been procured as capacity. This case is about the playbook that scaled storage and what pointing it at demand would add.
On a mild spring afternoon, solar alone approaches CAISO's total demand. The surplus became 3.77 TWh of curtailed wind and solar in 2025, and midday wholesale prices now go negative in nearly a third of hours. Each evening the surplus disappears as solar rolls off. The system covers the climb CAISO calls the duck curve with gas, imports, and stored solar. Two events in that window carry this case. After the August 2020 evening blackouts, the state built a strategic reserve that put $2.37 billion into supply-side assets and $295 million into demand response. And on the evening of the all-time record peak in September 2022, a statewide emergency text was followed by a 2,385 MW drop in observed load within 16 minutes and no ordered outages. Conservation supplied the final margin, and no standing program pays for it.
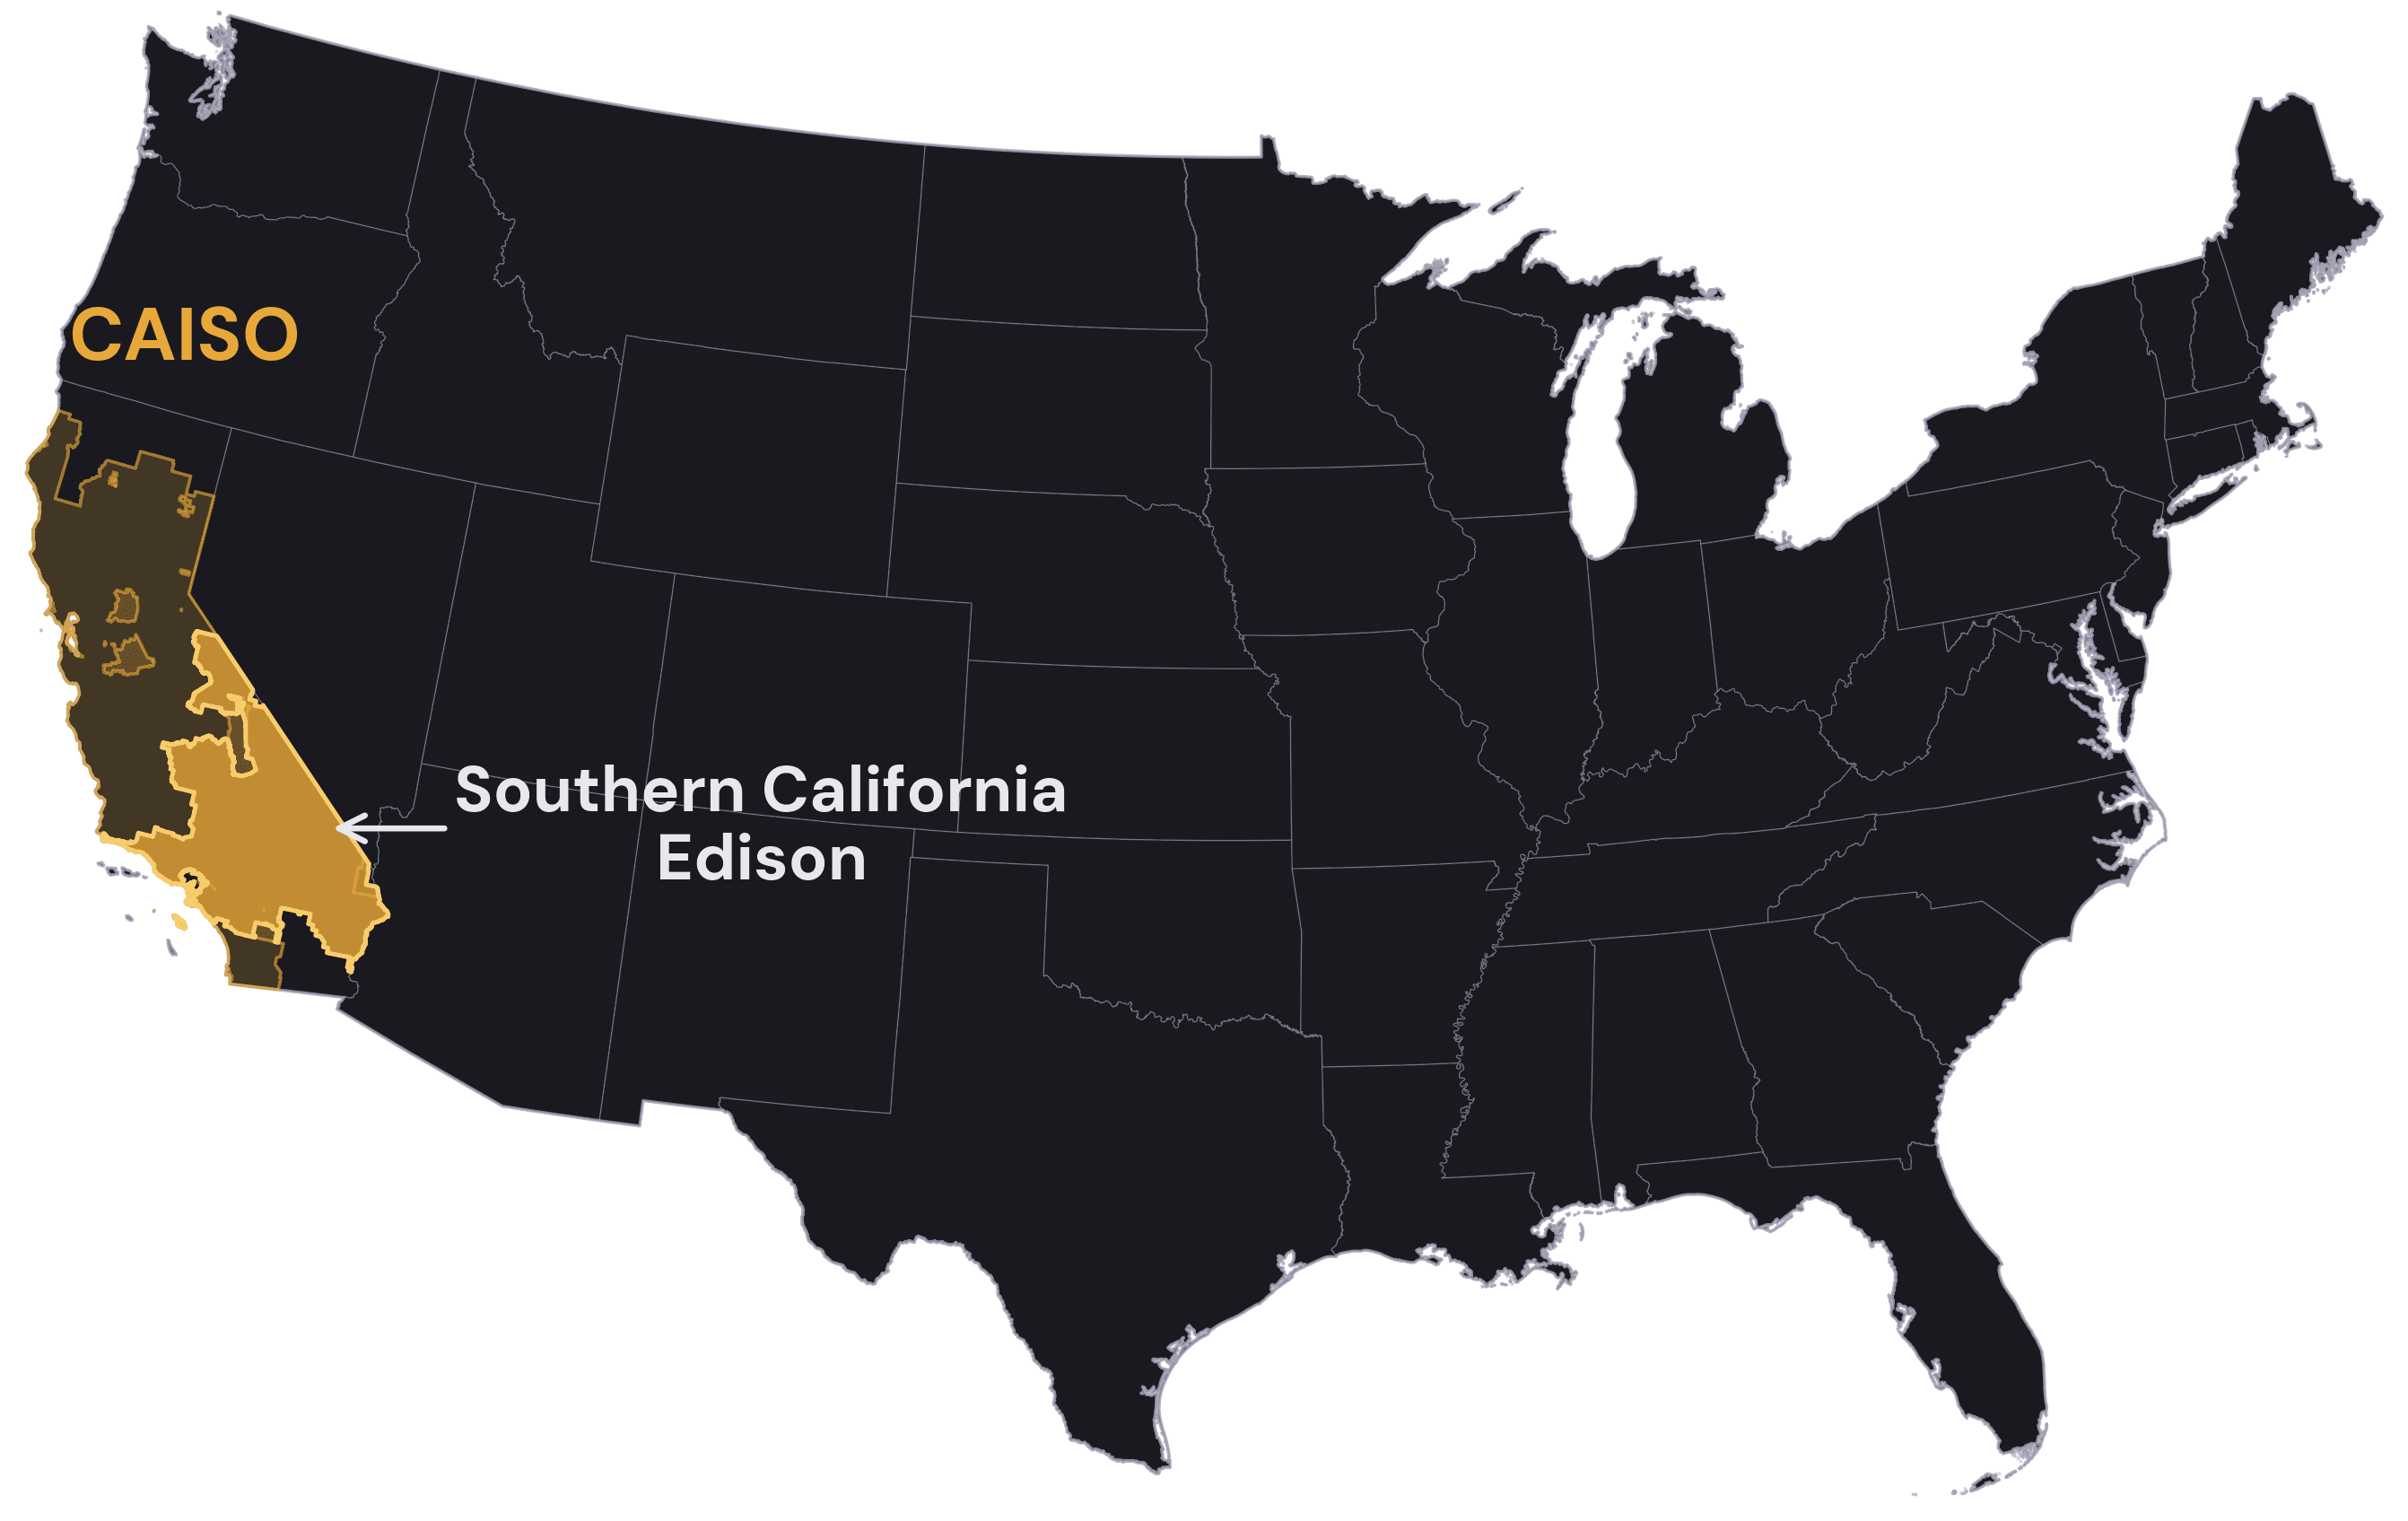
Southern California Edison provides a clear example. It delivers electricity to about 15 million people, one of the largest US utilities.# Like the other large California utilities, it owns the wires and some generation (hydro, gas units, and a share of the Palo Verde nuclear plant), but by its own estimate only about 15% of the power it delivered in 2025 came from SCE-owned facilities. The rest is purchased from external parties, mostly under long-term contracts, and all of it is scheduled and settled through the wholesale market that the California Independent System Operator (CAISO) operates across about 80% of California. Its customers are almost all metered, with SCE reading about 99% of its homes on advanced meters (against 84% nationally) since 2013.
The Pattern
SCE's system load peaks between 4 and 9 PM. A grid can meet that peak two ways, by adding supply or by shifting demand. California ran the supply play in full: ordered, paid for capacity, financed, and connected directly to the market. The demand play has so far received those instruments in fragments: a price signal, small event programs, and RA lanes through forecasts, utility DR credits, or third-party aggregators. None of it amounts to procurement at storage scale. The ledger below puts the two side by side.
| How each side was procured | Supply (grid battery) | Demand (home battery in a VPP) |
|---|---|---|
| Procurement mandate | 14.8 GW ordered (CPUC D.19-11-016 + D.21-06-035) | None |
| Capacity payment | Resource adequacy, about $138/kW-year, paid directly | RA value exists through load modifiers, utility DR credits, or third-party proxy-demand-resource (PDR) supply plans; Demand Side Grid Support (DSGS) pays about $108/kW-year but is state-funded and was pulled back in 2025 |
| Market access | Direct (wholesale energy and capacity) | Indirect, through aggregation: PDR/PDR-LSR for demand-response RA; DERA/FERC 2222 for energy and ancillary services |
| Capital subsidy | 30% federal tax credit | 30% federal tax credit (the one instrument that is roughly equal) |
| Result by 2026 | About 15 GW on the evening ramp | A few thousand SCE-program VPP sites, tens of MW |
The two sides share the tax credit. On the other three rows the supply side got a mandate, a durable capacity payment, and direct market access, while the demand side got partial versions that have not produced a comparable procurement pipeline. None of that was a mistake. The storage rows show procurement scaling flexibility quickly. The question the table raises is what the same three instruments would do pointed at the other side of the meter. The rest of this case is the table read row by row: what the supply side did with its instruments, what the demand side did with its fragments, and what procuring demand the supply way would take.
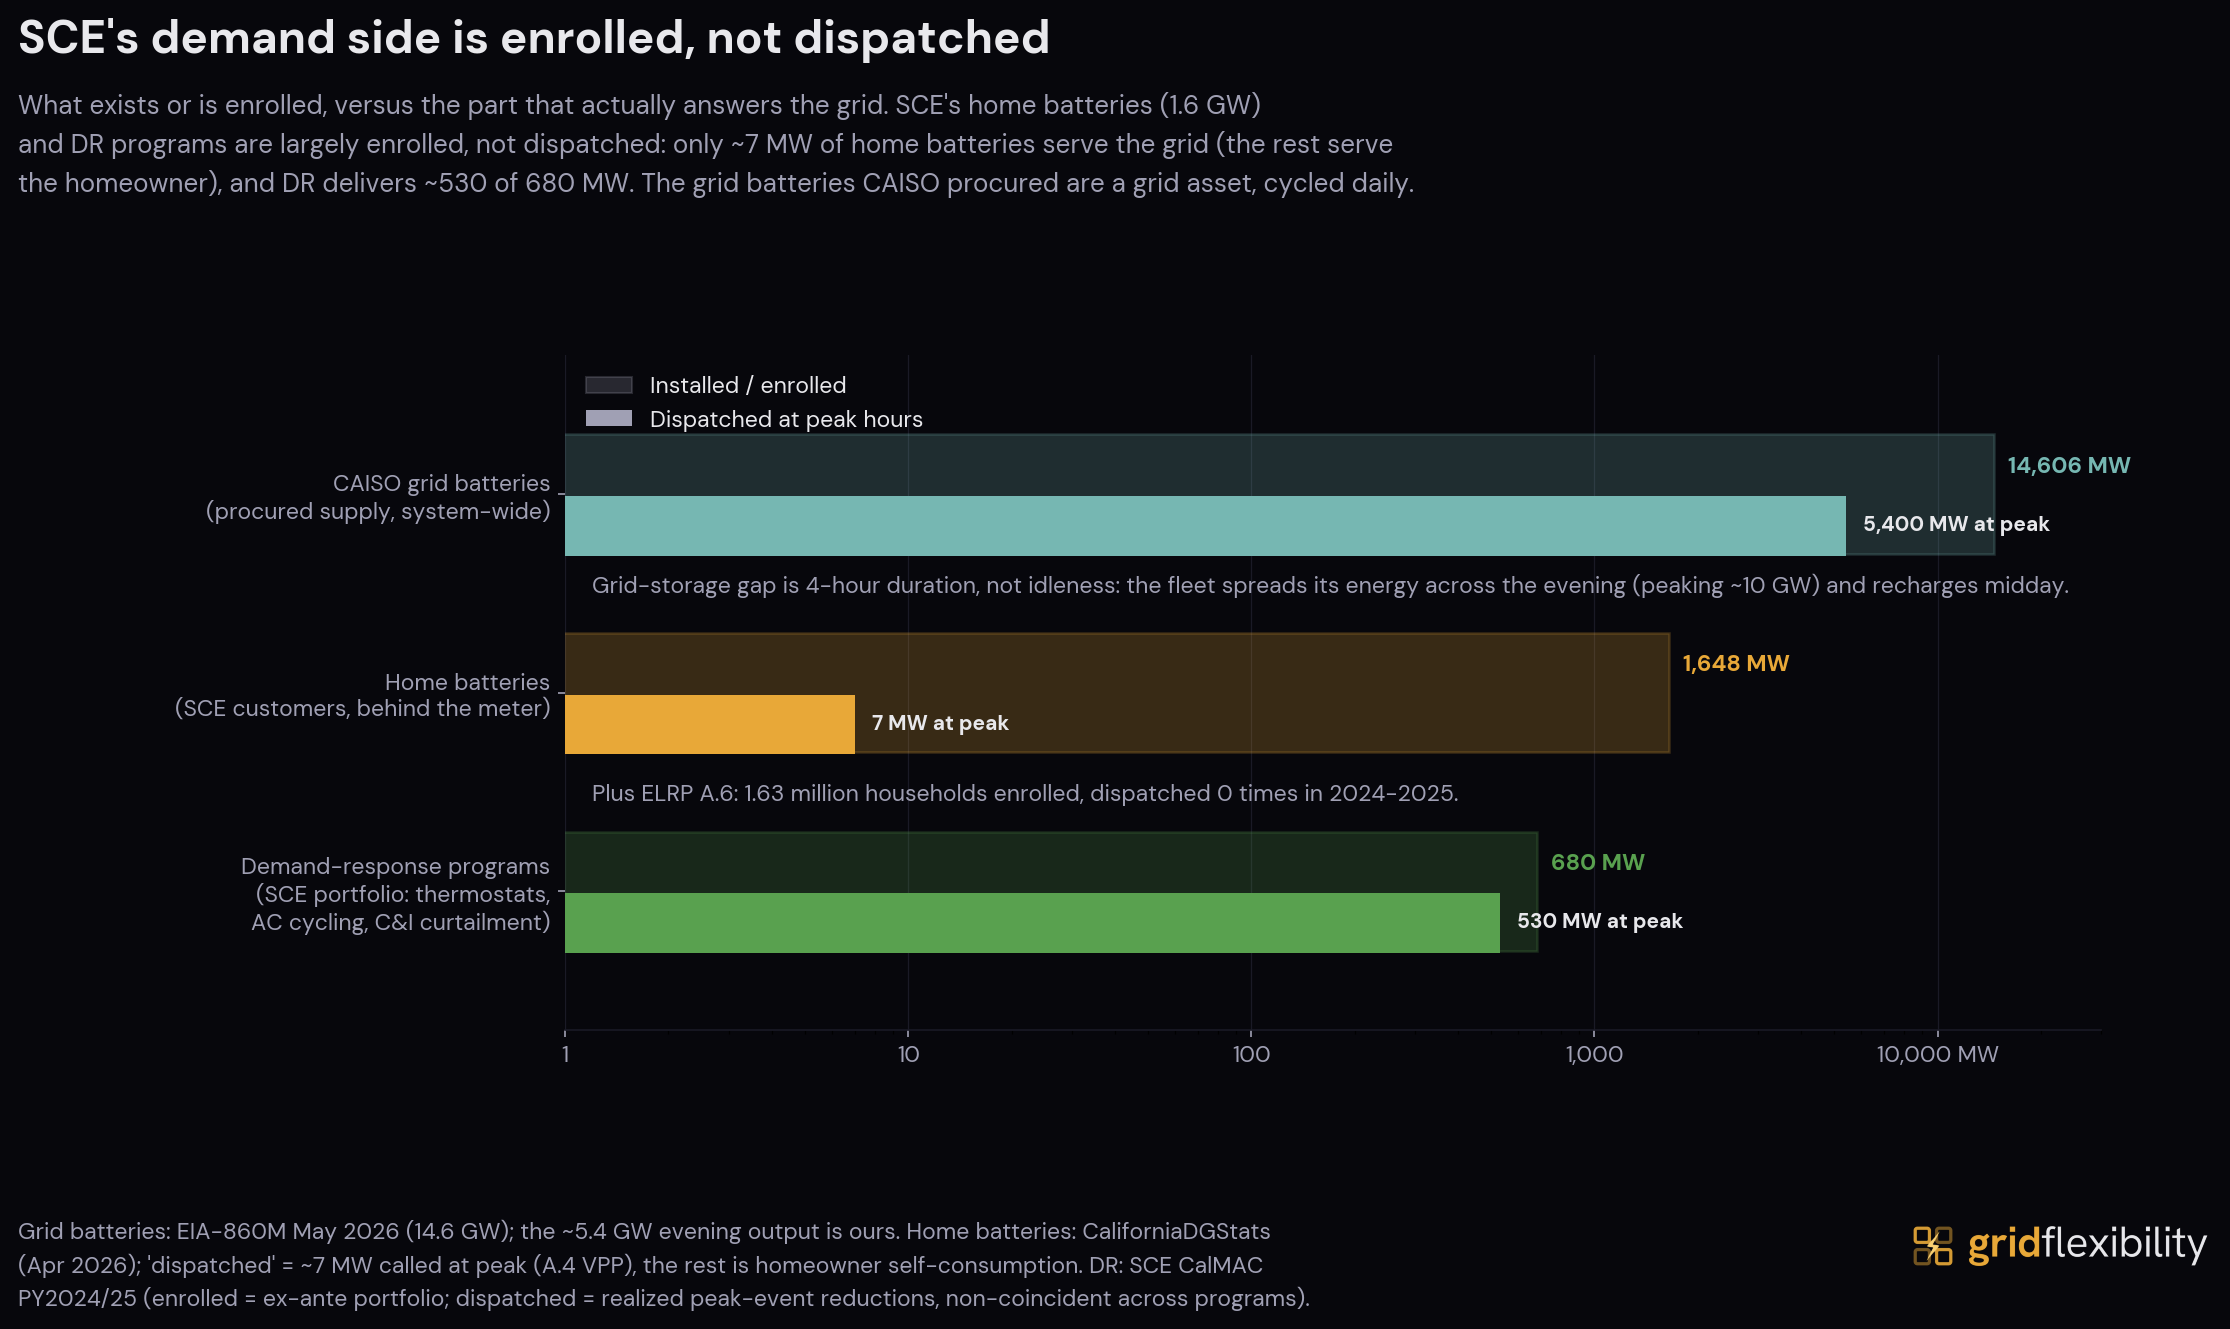
The figure puts the last row of the table in megawatts. CAISO's grid batteries, about 14.6 GW installed (CAISO-connected capacity, against the 14.8 GW the CPUC ordered and a statewide fleet of roughly 15 GW), put a median 5.4 GW onto the evening peak in 2025. The gap between those numbers is their four-hour duration, not idleness. Home batteries in SCE territory hold about 1.65 GW of installed capacity, and the slice enrolled in a grid program delivered 7 MW at peak. SCE's demand-response portfolio, about 680 MW enrolled, delivered about 530 MW when called. The 1.6 million households in the mass behavioral program were not called at all.
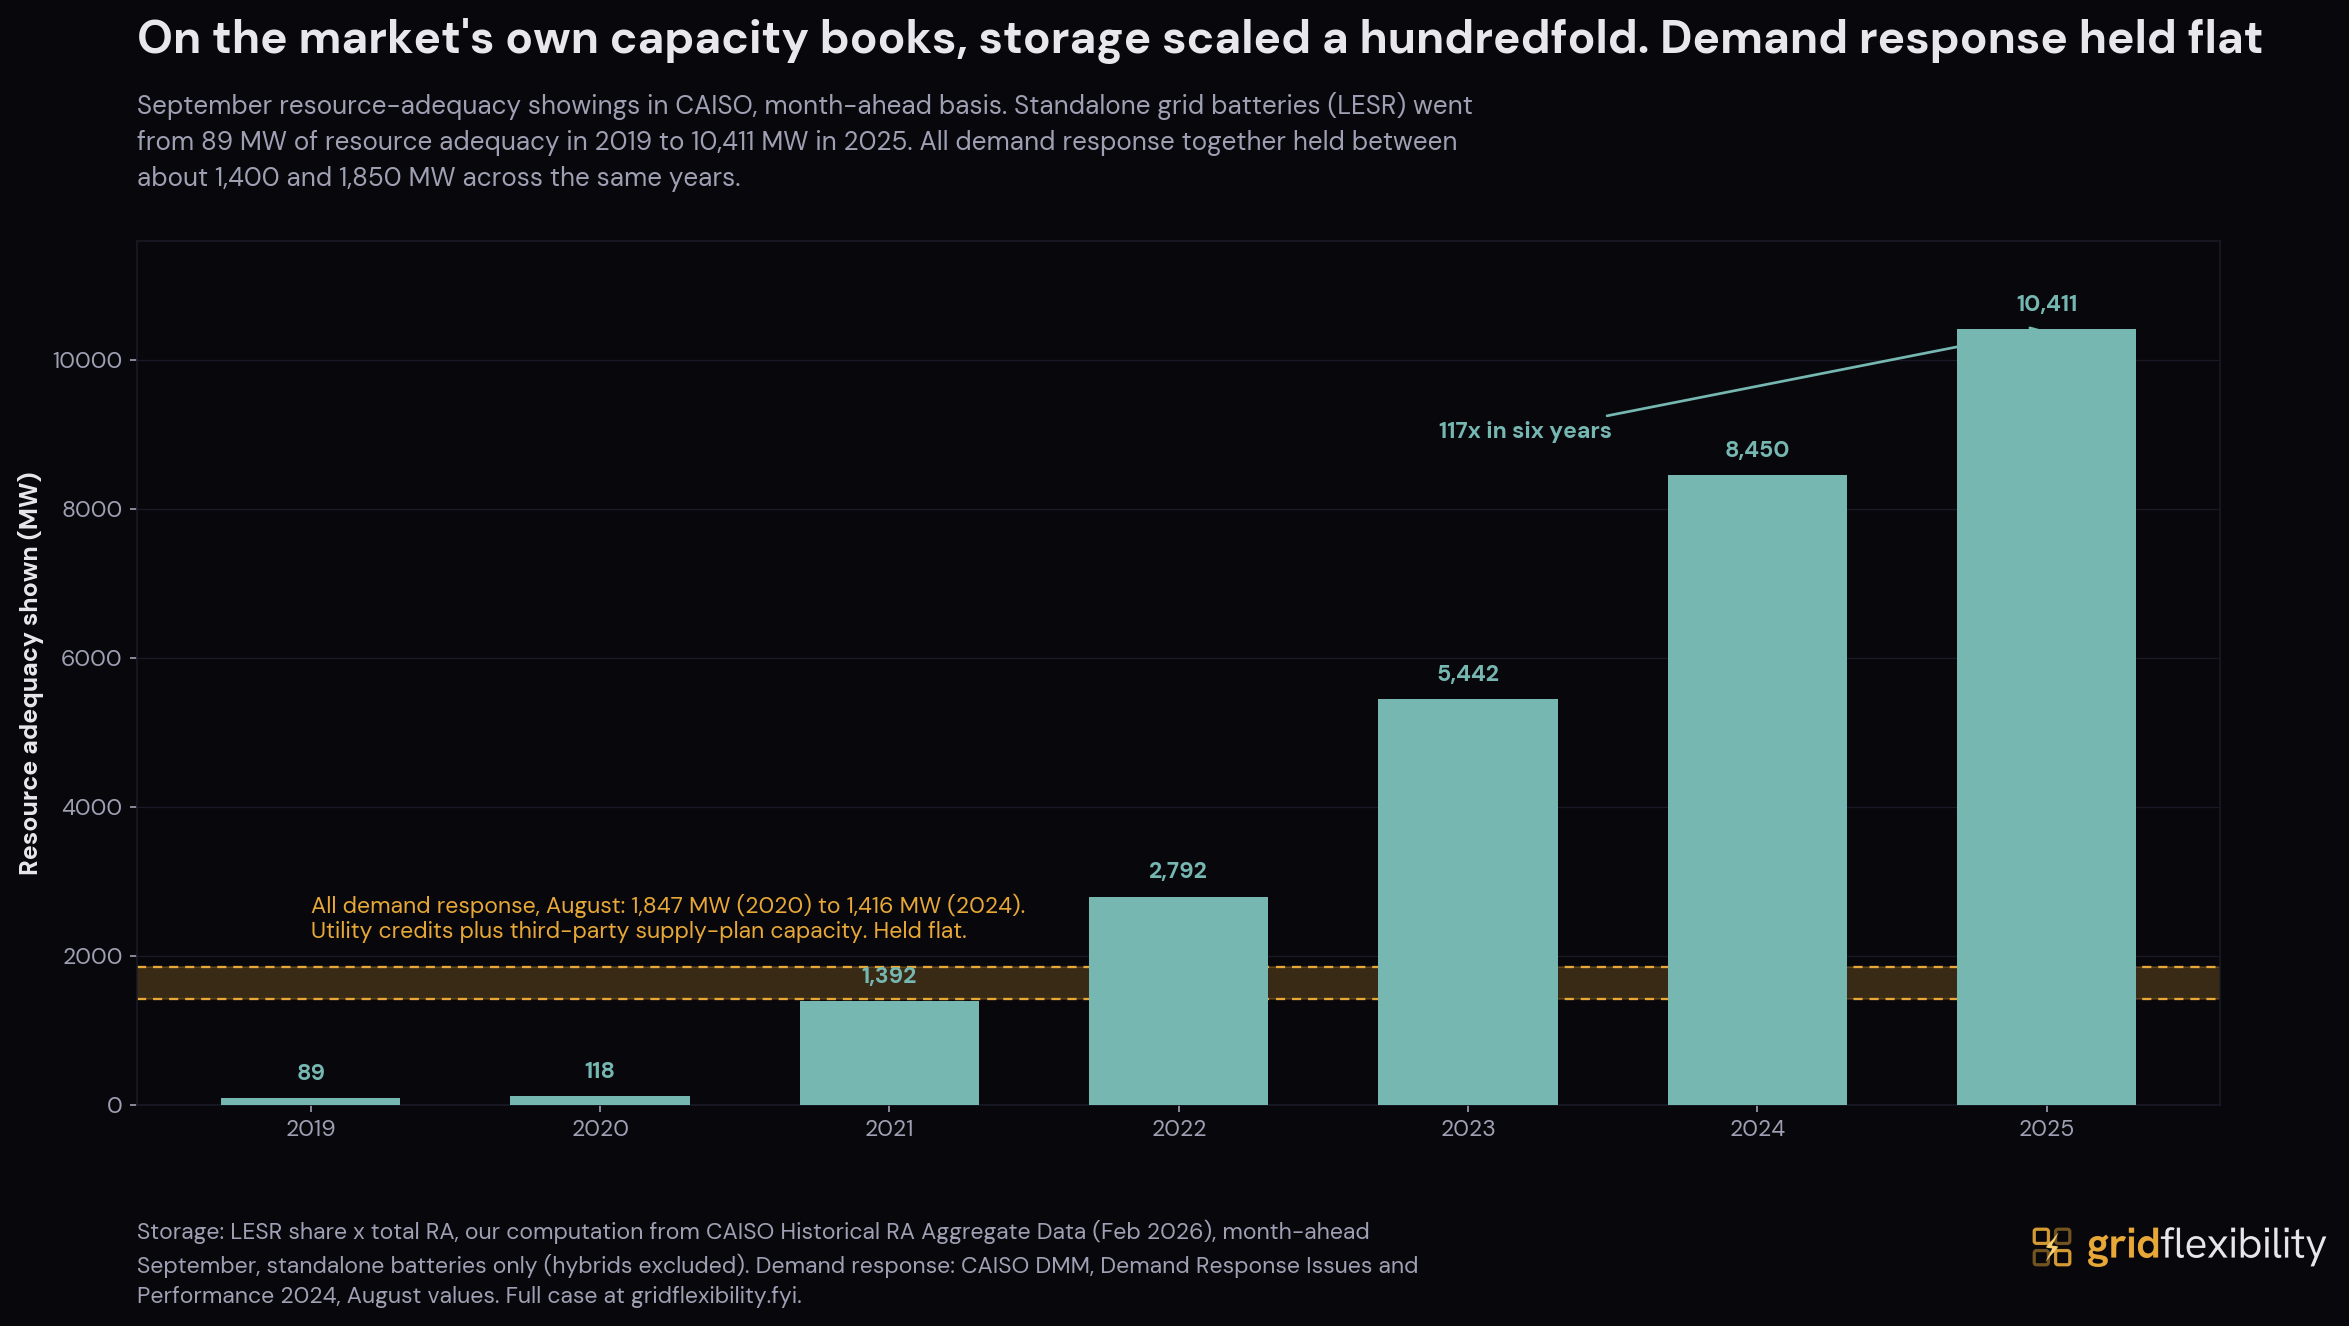
The same asymmetry is written on the market's own capacity books. On the month-ahead September showing, standalone grid batteries grew from about 0.2% of California's resource adequacy in 2019 to about 17.5% in 2025, or from 89 MW to about 10.4 GW, passing the entire demand-response fleet in 2022. All demand response together, counted through utility credits and third-party supply plans, held between about 1.4 and 1.85 GW, and part of the dip after 2020 reflects a CPUC accreditation change rather than lost capacity. Both series are CAISO resource-adequacy megawatts, but they are counted on different bases: the battery line is standalone storage on the September showing (hybrids that also serve the evening are counted separately), and the demand-response line is the market monitor's August figure. Read as scale rather than a single ratio, one side climbed into the double digits and the other did not.
None of this is unique to California. Nearly every organized US power market pays supply for capacity and offers demand a price. ERCOT, which runs an energy-only market, is the exception on the supply side.
Demand Pressure
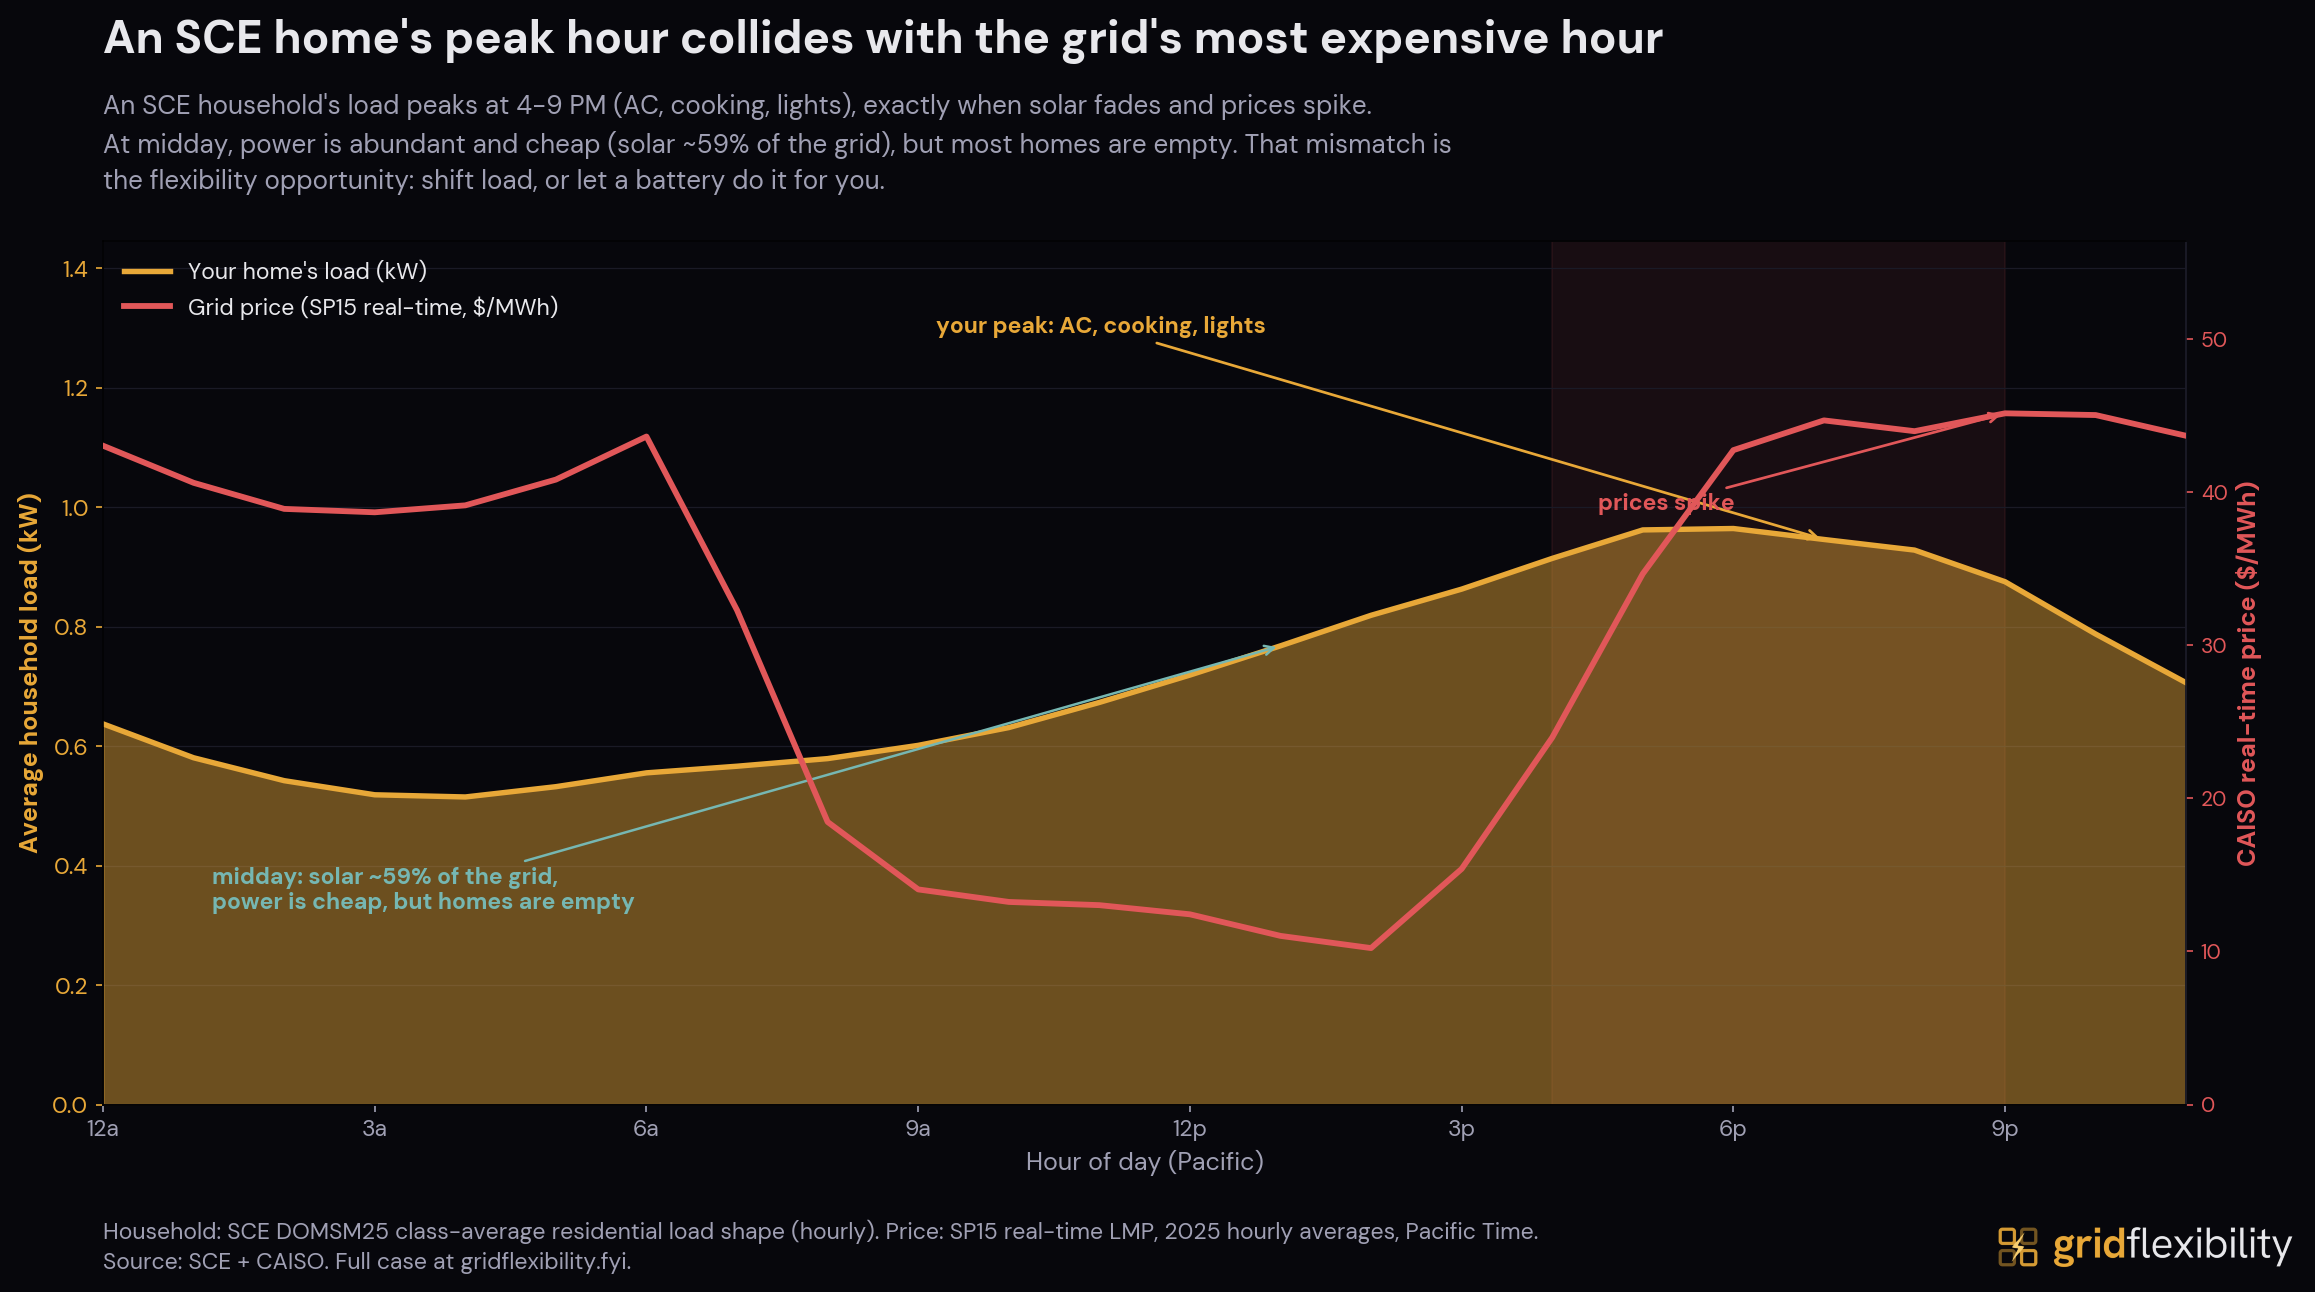
A home's heaviest hours, 6 to 8 PM, are also the grid's most expensive. SCE's residential class-average load peaks in that window, and the real-time wholesale price follows the same shape, so the household and the system strain in the same hours.
SCE's load is growing about 1% a year through 2028, and the new residential demand lands in the evening rather than filling the empty midday. The loads the CEC forecast points to are electrification loads, EVs and heat pumps, which draw power in the hours households are home. This is what separates SCE from a data-center utility. In our Dominion case, the growth is hyperscaler load that runs flat around the clock. Here it is households plugging in after work, concentrated in the hours that already set the peak. Data centers are only about a seventh of that near-term growth. The cost lands on the wires either way, but the timing problem is SCE's own.
Two system-wide reliability events happened in that window. On August 14 and 15, 2020, rotating outages hit hundreds of thousands of California customers, ordered at 6:38 PM the first evening and 6:28 PM the second, the first time CAISO had shed load for system-wide conditions since 2001. Both orders came within minutes of the evening net-demand peak, just after solar rolled off. The official root-cause analysis found no single failure, and its first finding was that planning had not kept up with this hour.
Two years later the same window produced a different outcome. On September 6, 2022, CAISO hit its all-time record peak of 52,061 MW and declared its highest emergency level at 5:17 PM.# At 5:45 PM the state pushed a wireless emergency alert to phones across 27 counties: “Conserve energy now to protect public health and safety. Extreme heat is straining the state energy grid. Power interruptions may occur unless you take action. Turn off or reduce nonessential power if health allows, now until 9pm.” In CAISO's own post-event accounting, observed load fell 2,385 MW in the 16 minutes that followed, and no CAISO-ordered outages happened that night. Batteries (about 4 GW that day) and imports carried much of the evening, but the final margin came from conservation. The alert was an emergency measure, and no standing program compensates that reduction outside declared emergencies.
What California built to fill that gap comes next.
Supply and Imports
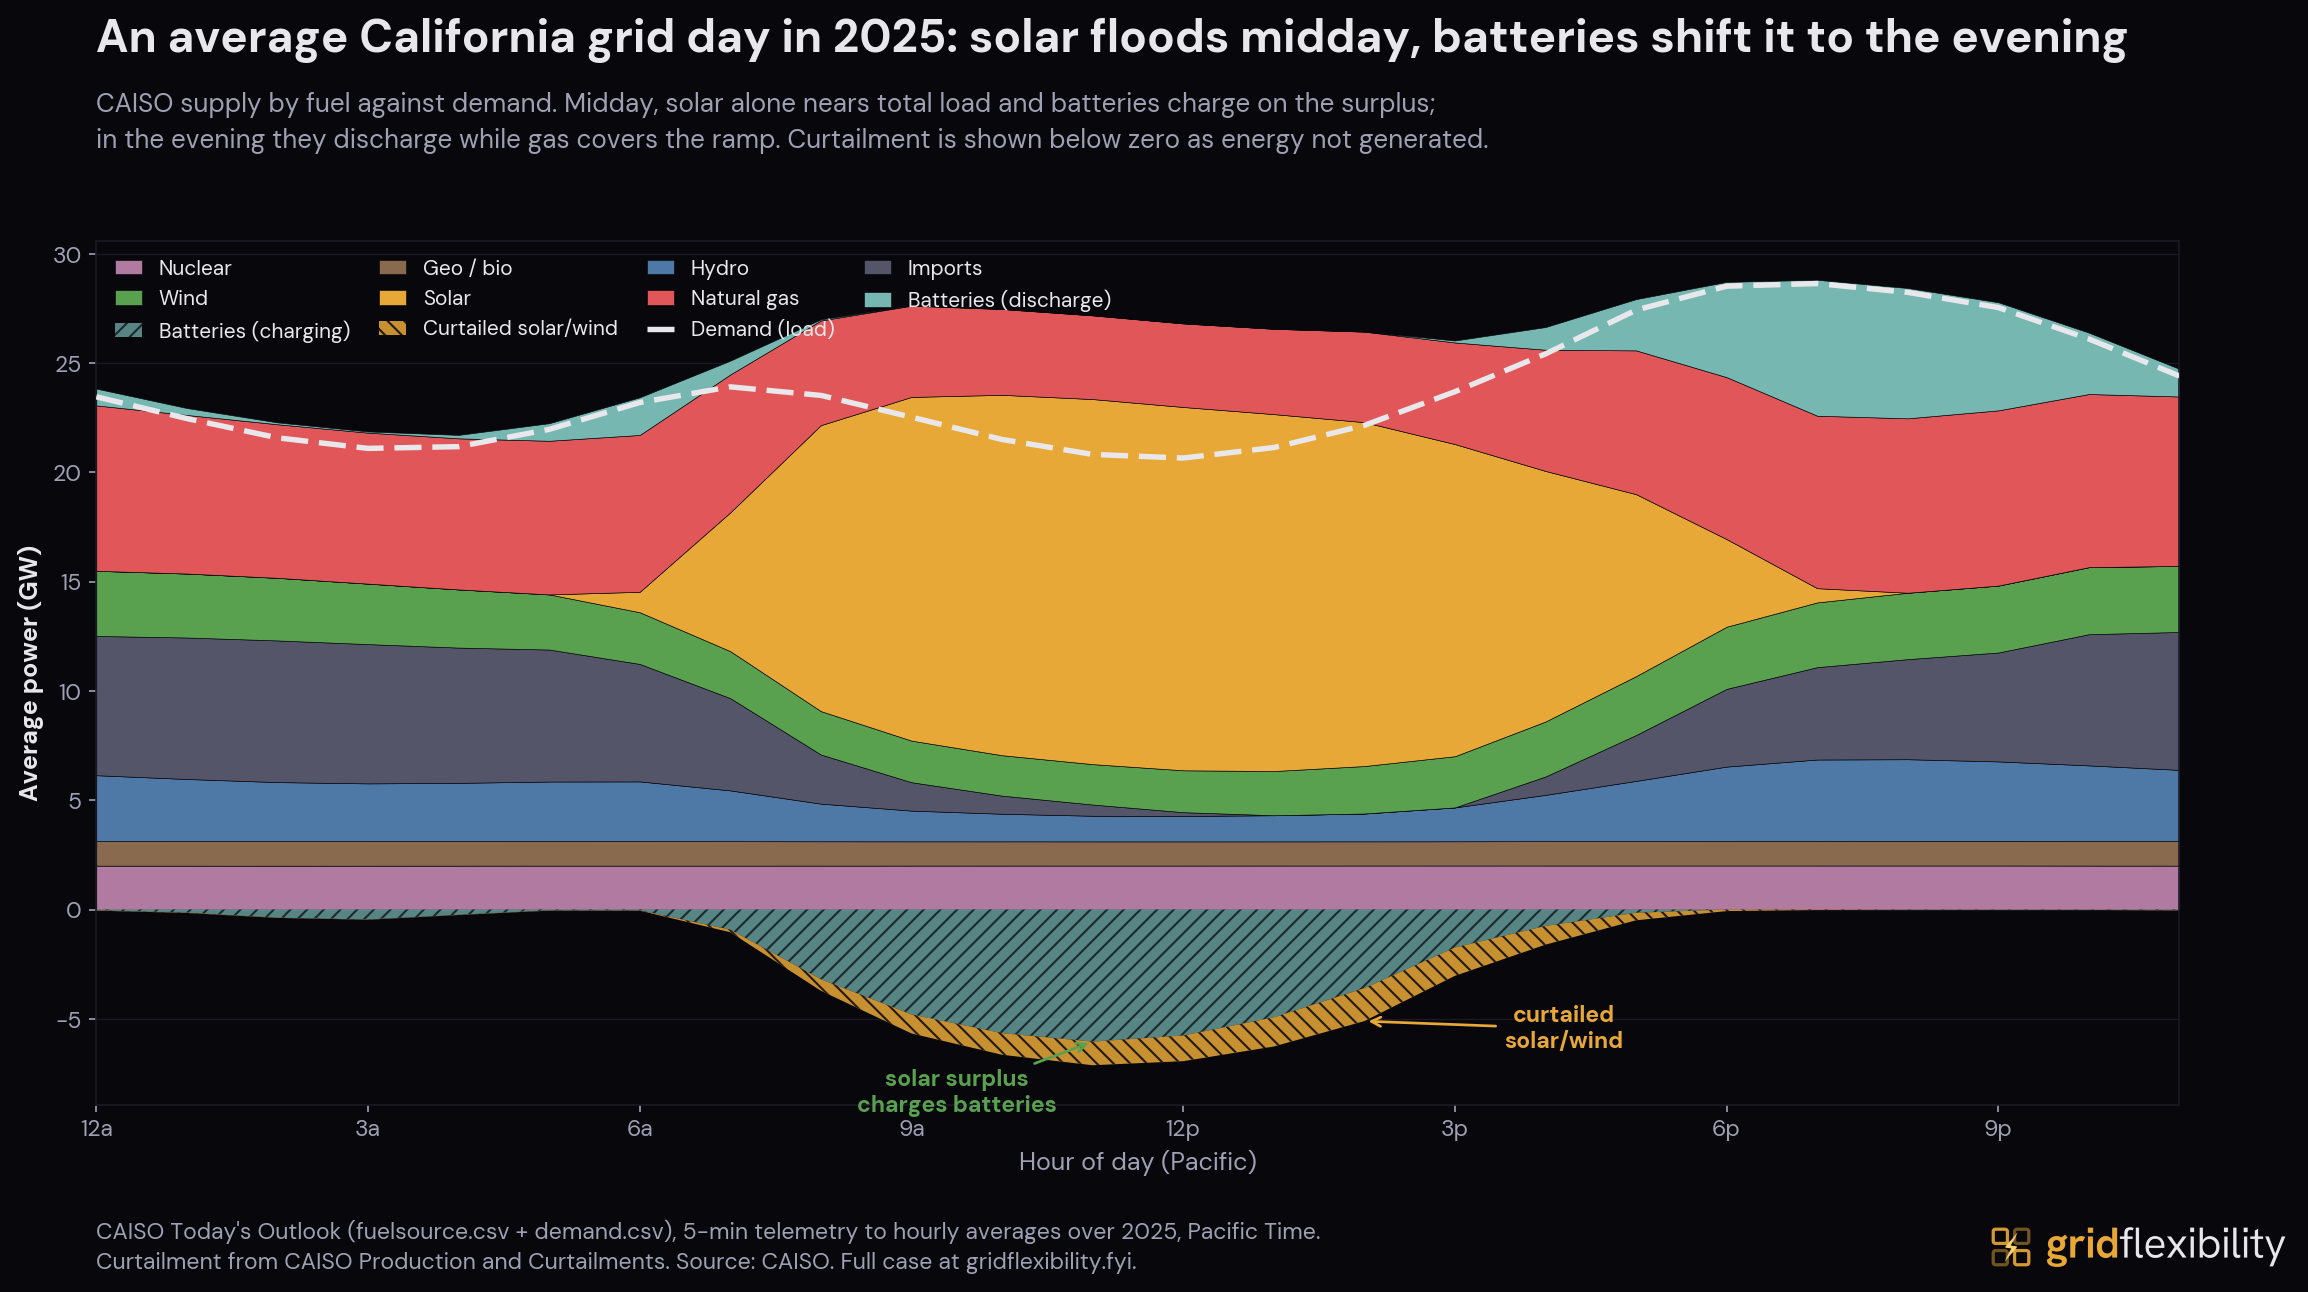
The first panel is an average CAISO day in 2025, supply by fuel against the load line. Around midday, solar alone nears total load and the grid runs a surplus. Batteries charge against it, and what the grid still cannot absorb is curtailed (the two bands below the axis). The batteries discharge into the evening as solar falls, while gas, imports, and hydro cover the rest of the ramp. This is the net-load shape of CAISO's duck chart, the deepening midday belly and steepening evening head that earned the shape its industry name. The ISO drew the chart as a warning about a roughly 13 GW three-hour evening climb and a midday oversupply risk. Both arrived.
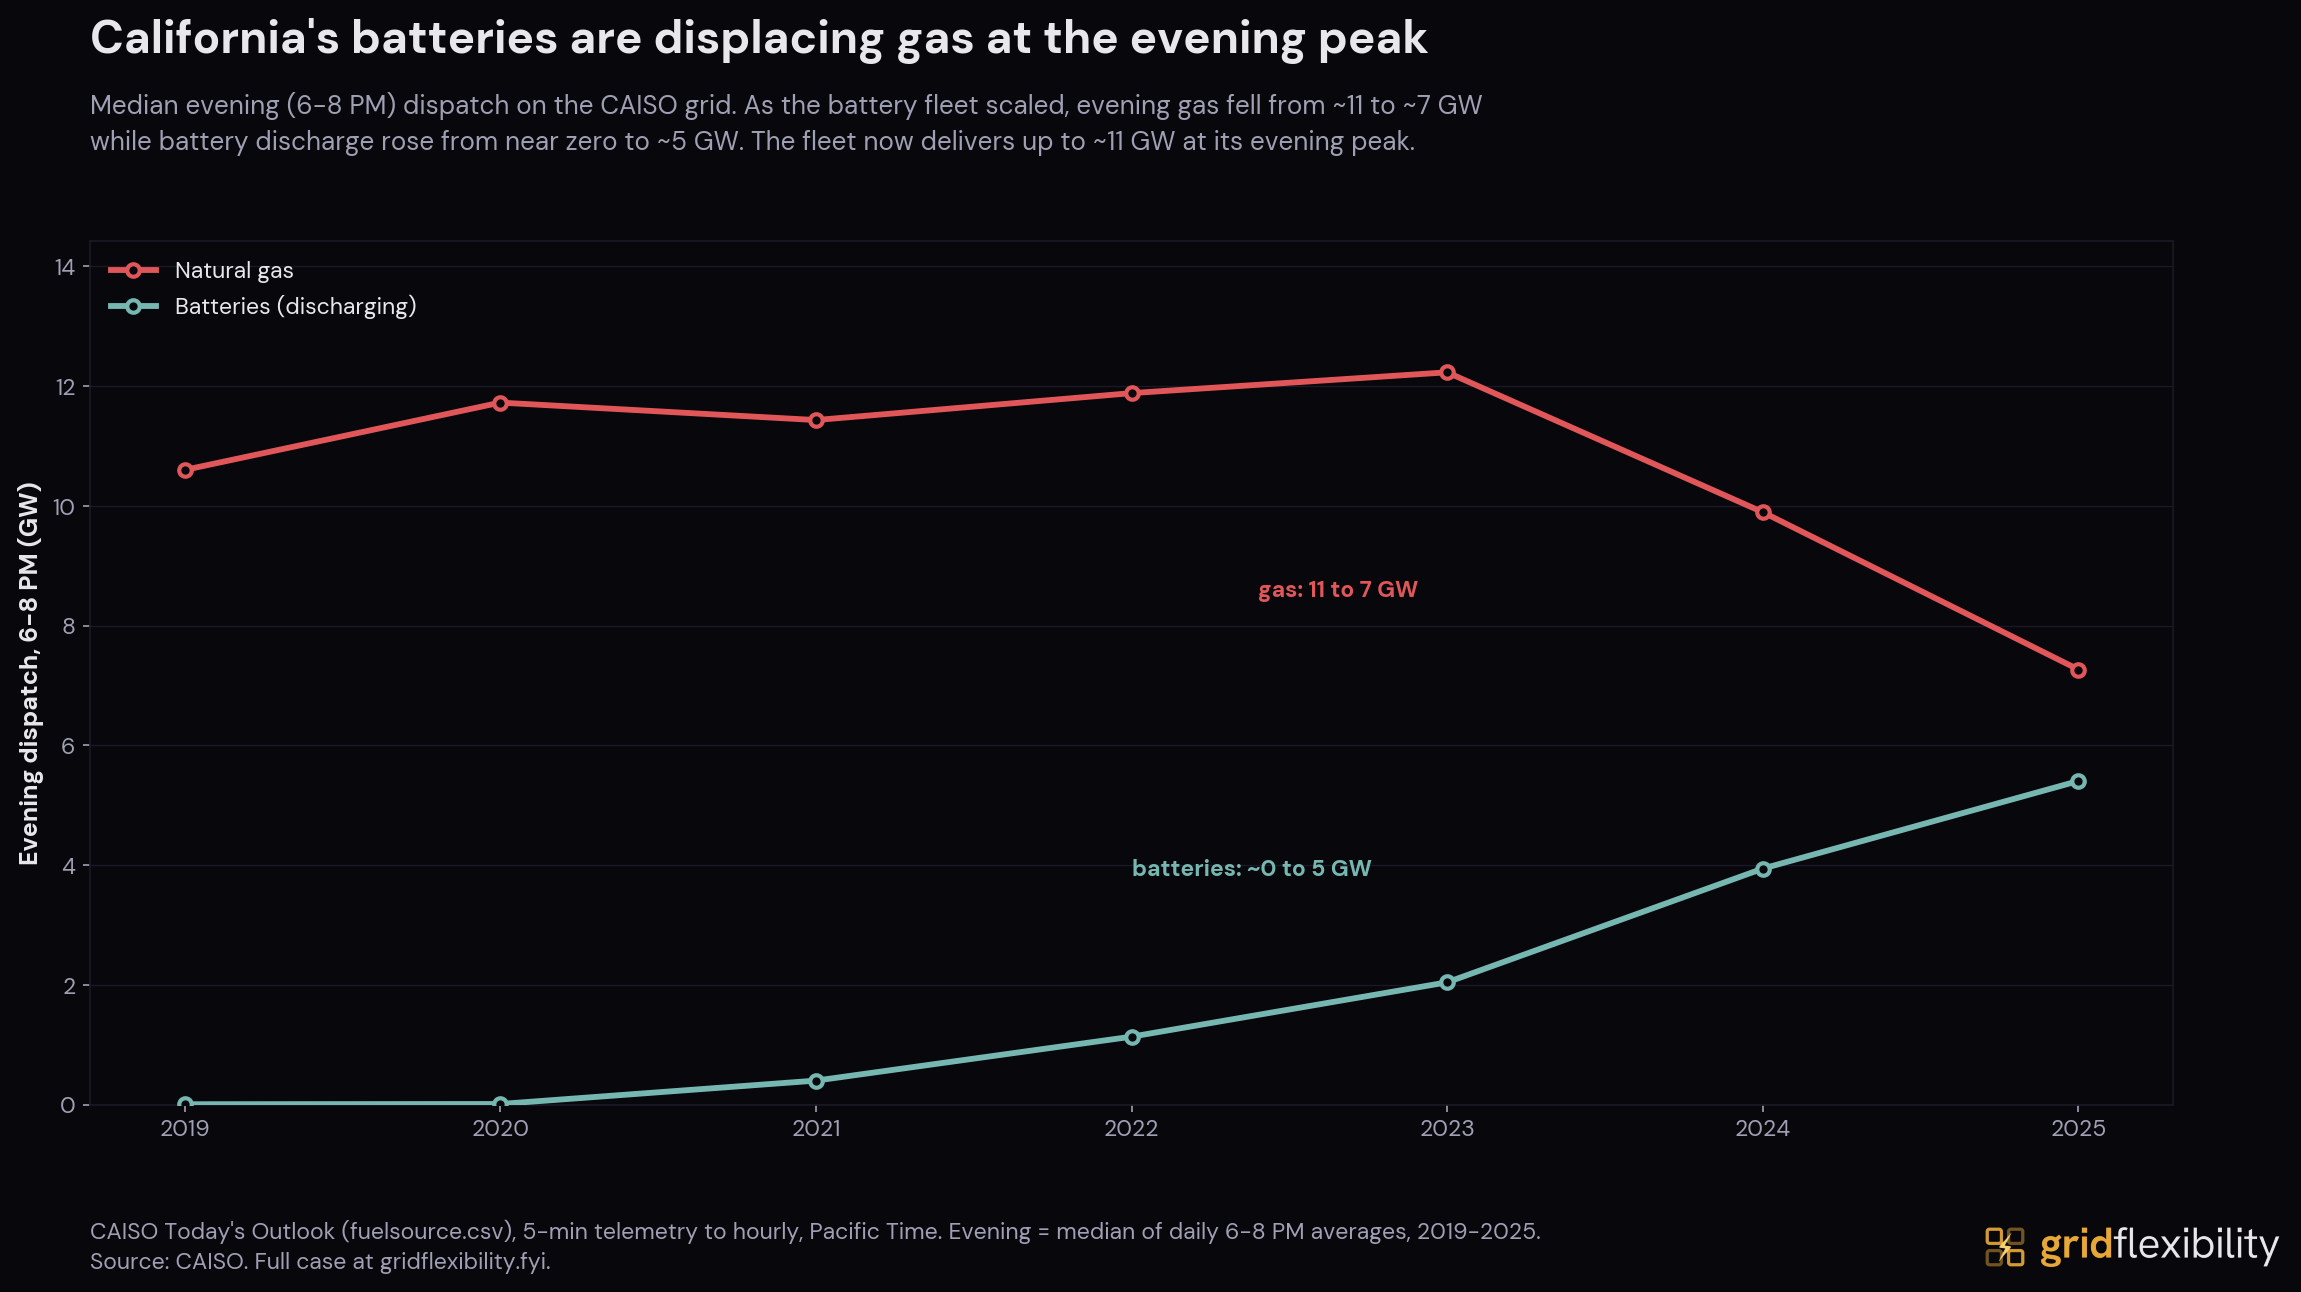
The dispatch record shows the displacement. In the 6-to-8 PM window, median battery discharge rose from near zero in 2019 to 5.4 GW in 2025, and evening gas burn fell about 3 GW over the same years. Gas is still the larger evening source, and a fleet of mostly four-hour batteries cannot cover the whole ramp.
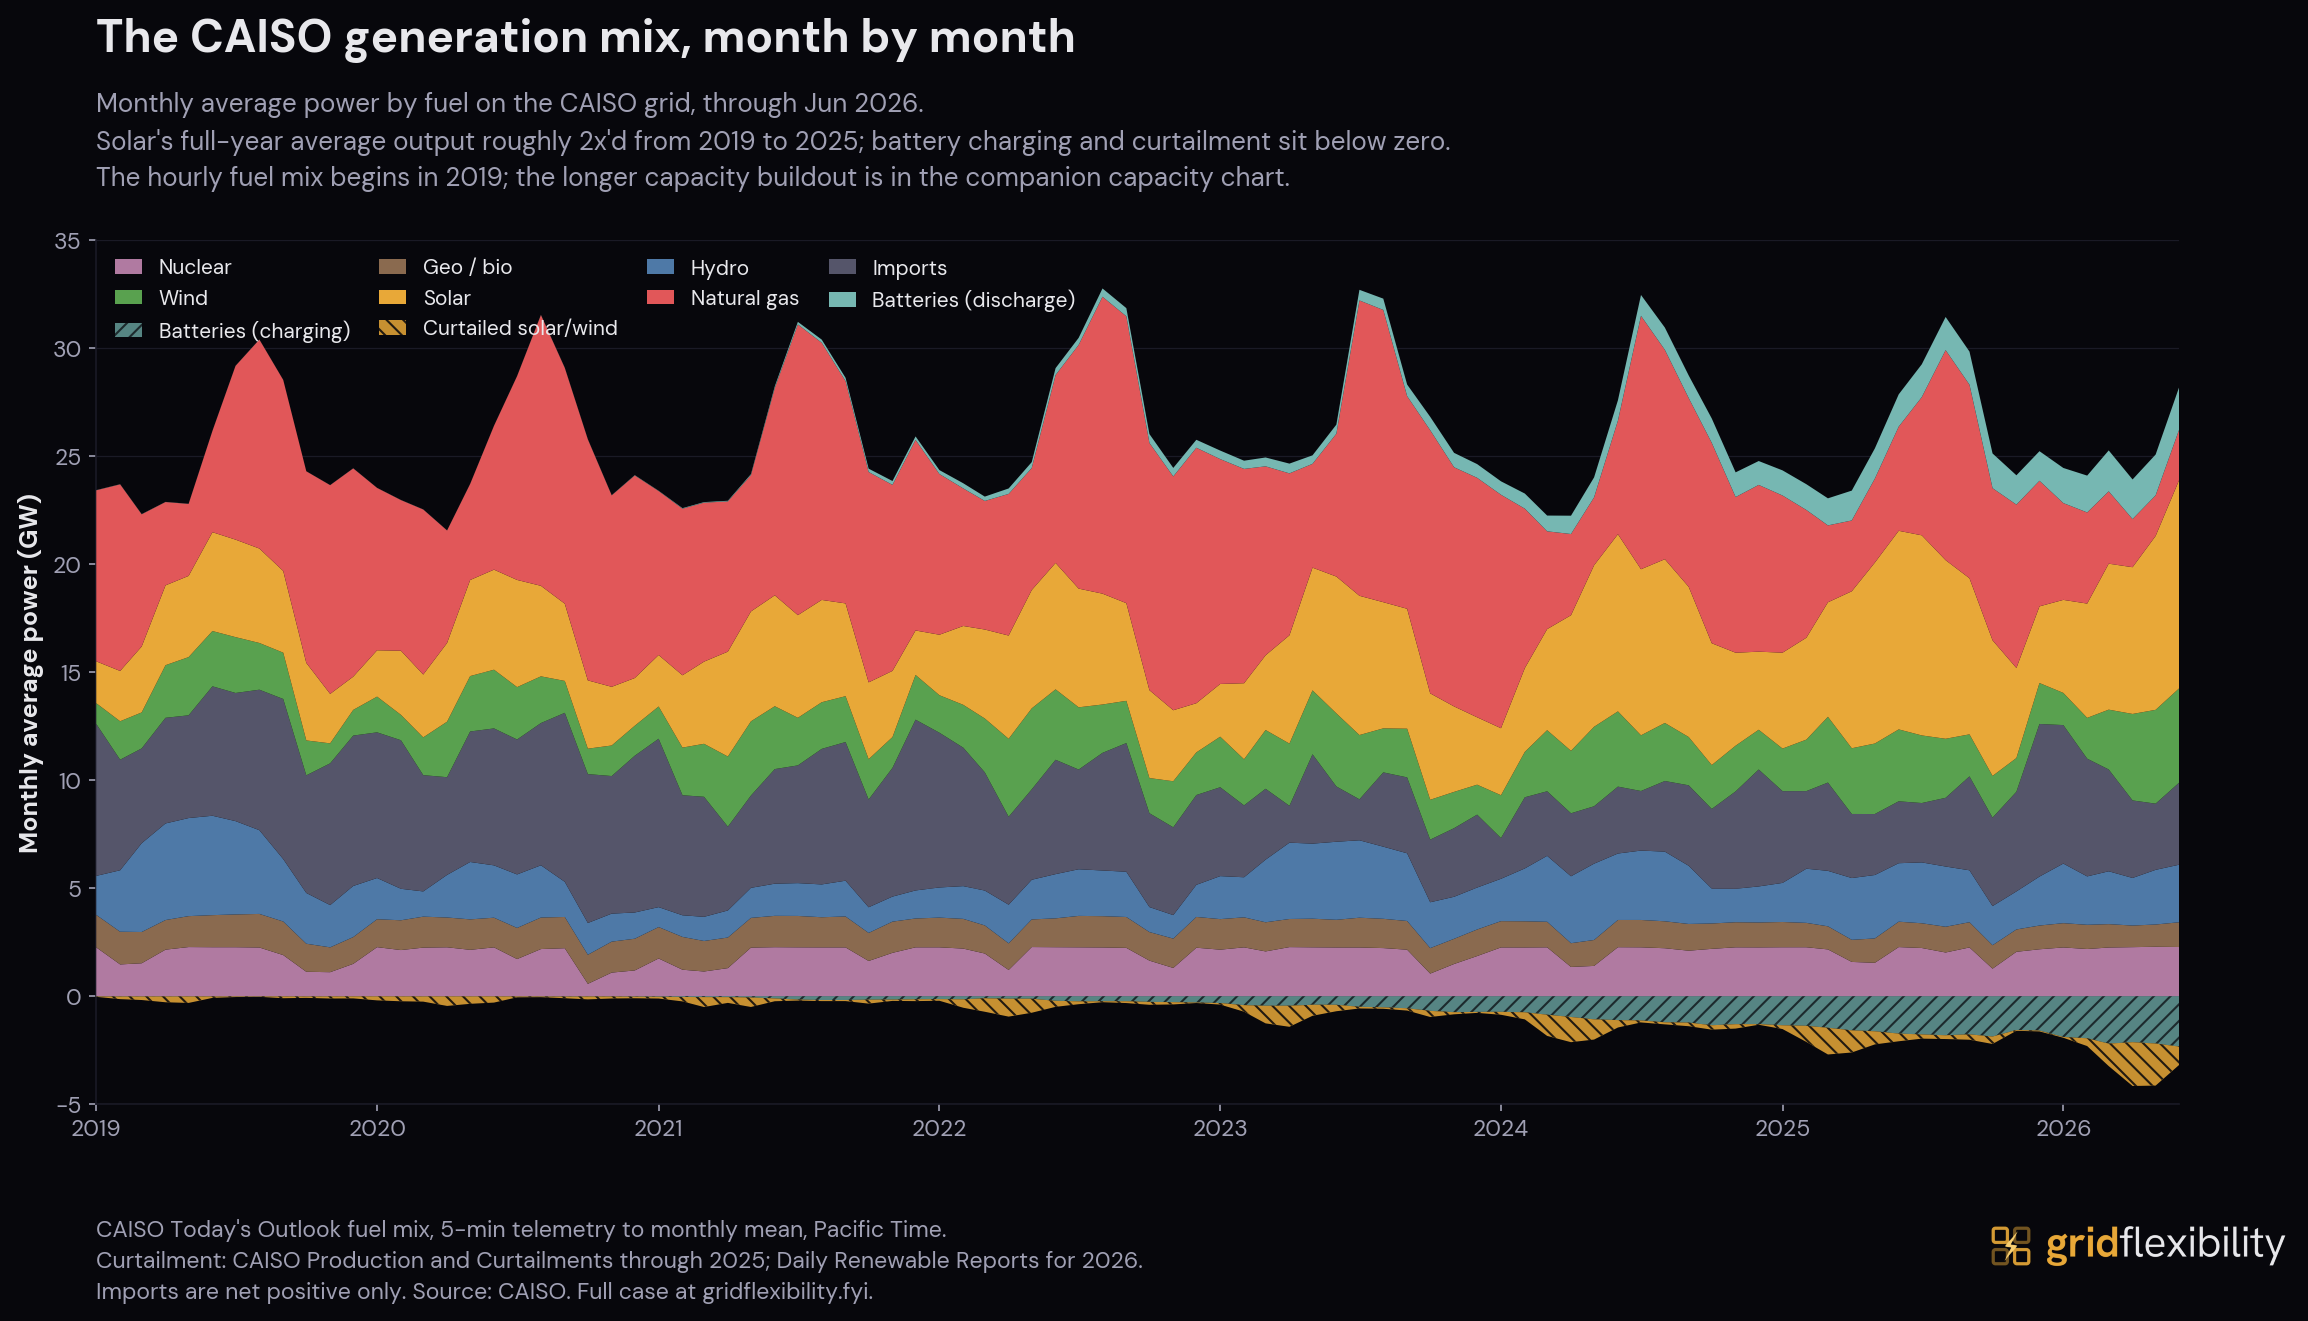
Month by month, the same rotation shows up in the mix itself. Battery discharge appears on the top of the stack after 2021, and the bands below zero (charging, and the solar the grid curtails outright) deepen every spring.
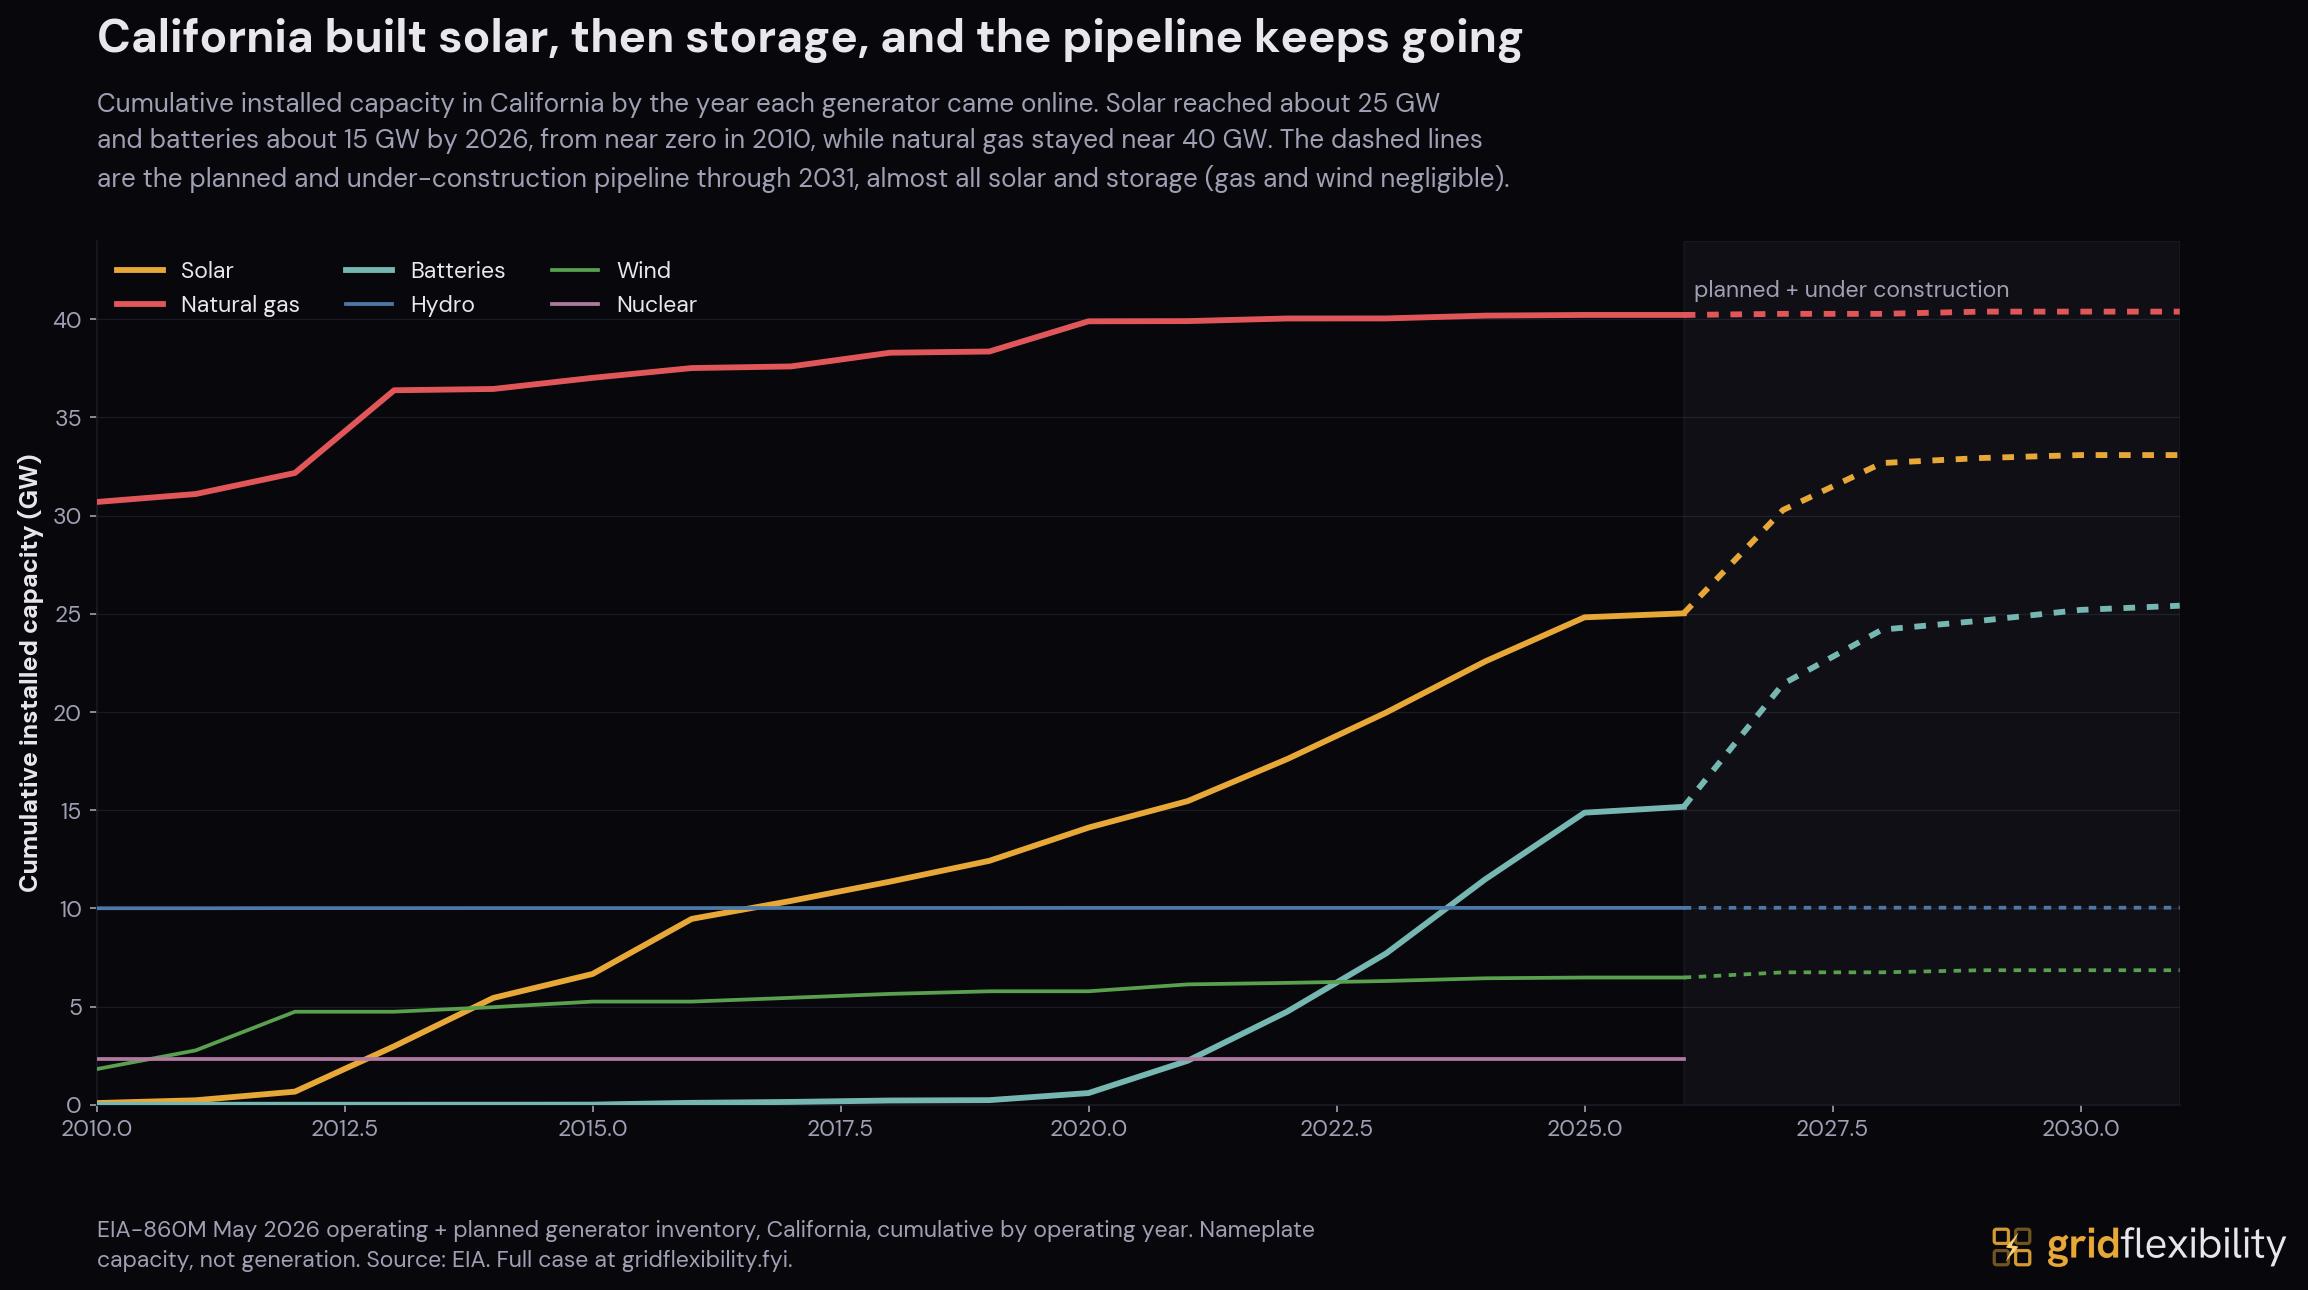
California's battery capacity went from 0.55 GW in 2020 to about 15 GW by the start of 2026 (EIA-860M), and it scaled on three policy supports. The state ordered the capacity through CPUC procurement (D.19-11-016 added 3.3 GW, D.21-06-035 another 11.5 GW). The resource-adequacy market pays it for capacity on today's four-hour accreditation, which a four-hour battery meets almost exactly. And the federal investment tax credit cut the cost of building it. A managed water heater or a smart EV charger could shave the same evening ramp, but none of those three supports points at them.
The fleet is also the newest rung on a much older ladder, because California has been procuring its supply mix by mandate for a quarter century:
| Year | Instrument | What it did for supply |
|---|---|---|
| 1995 | Net metering (SB 656) | Full-retail export credit that built the rooftop fleet; by its 2022 retirement the CPUC credited it with enabling 1.5 million customers to install “more than 12,000 megawatts of renewable generation” |
| 1996 | Restructuring (AB 1890) | Created the wholesale market CAISO opened in 1998 |
| 2001 | SGIP | Crisis-era peak-load rebates, redirected in 2016 to put three-quarters of its budget into storage |
| 2002 | Renewables mandate (SB 1078), ratcheted through SB 100 | 20% of retail sales, escalating to 60% by 2030 and 100% clean by 2045 |
| 2004 | Resource adequacy (detailed below) | Every load-serving entity must buy capacity ahead of need |
| 2006 | California Solar Initiative + 30% federal tax credit | Rooftop rebates and federal financing |
| 2010 | AB 2514, then D.13-10-040 in 2013 | 1,325 MW of storage ordered, widely described as the first US storage mandate |
| 2016 | Aliso Canyon order (detailed below) | SCE ordered to procure grid storage on an expedited schedule |
| 2019-2021 | D.19-11-016 + D.21-06-035 (linked above) | 3.3 GW, then 11.5 GW of new capacity ordered |
| 2022 | SB 846 + AB 205 (detailed below) | Diablo Canyon extended, strategic reserve built |
Every layer of the supply stack was ordered or financed by a named instrument, and that includes both halves of the duck. The solar that created the midday surplus and the batteries that serve the evening climb were both procured under those instruments. Demand-side flexibility has payment programs and a state target, covered in the sections below, but no comparable procurement mandate.
The capacity payment dates to the 2000-01 electricity crisis, which hit two years after the restructured market opened. After those blackouts and the PG&E bankruptcy, the CPUC ordered every load-serving entity to procure capacity ahead of need (a 15 to 17% reserve margin, set in 2004), and the legislature wrote the obligation into law in 2005. In 2016, when the Aliso Canyon gas leak put fuel supply to Los Angeles Basin power plants at risk, the CPUC ordered SCE to procure grid storage on an expedited schedule. Tesla's 20 MW Mira Loma battery was operating 88 days after construction began, by SCE's own account, and trade press called the buildout the world's fastest grid-scale battery procurement. After the August 2020 outages, the state ordered the 11.5 GW noted above, extended Diablo Canyon with a state loan of up to $1.4 billion, and built a strategic reserve that split $2.37 billion into supply-side assets, $700 million into distributed backup generation and storage, and $295 million into the demand-response DSGS program. By 2025 the reserve's two smaller lines had both lost funding: the state reverted DEBA's money and put its grant round on hold, and declined to renew DSGS, while the $2.37 billion supply reserve and the storage mandate continued. The demand-side additions of the same period were an emergency-only pilot program and the wireless-alert protocol; DSGS returns later in this case.
That spending split invites an objection. A four-hour battery is, device for device, the better evening-ramp resource. It is firm, weather-independent, telemetered, available on every event, and accredited at four hours under today's rules, where a home battery is smaller, derated for availability, and (at a typical two to three hours of storage) counts for less than its nameplate. A resource-adequacy reform now underway (UCAP, for the 2028 delivery year) would re-accredit both sides on a marginal-reliability basis. Per kilowatt, the grid battery is plausibly worth about twice as much as capacity. That difference is about which device is better, not about how much of each was procured. The value gap between the two devices is roughly a factor of two. The gap in the ledger is closer to a hundredfold.
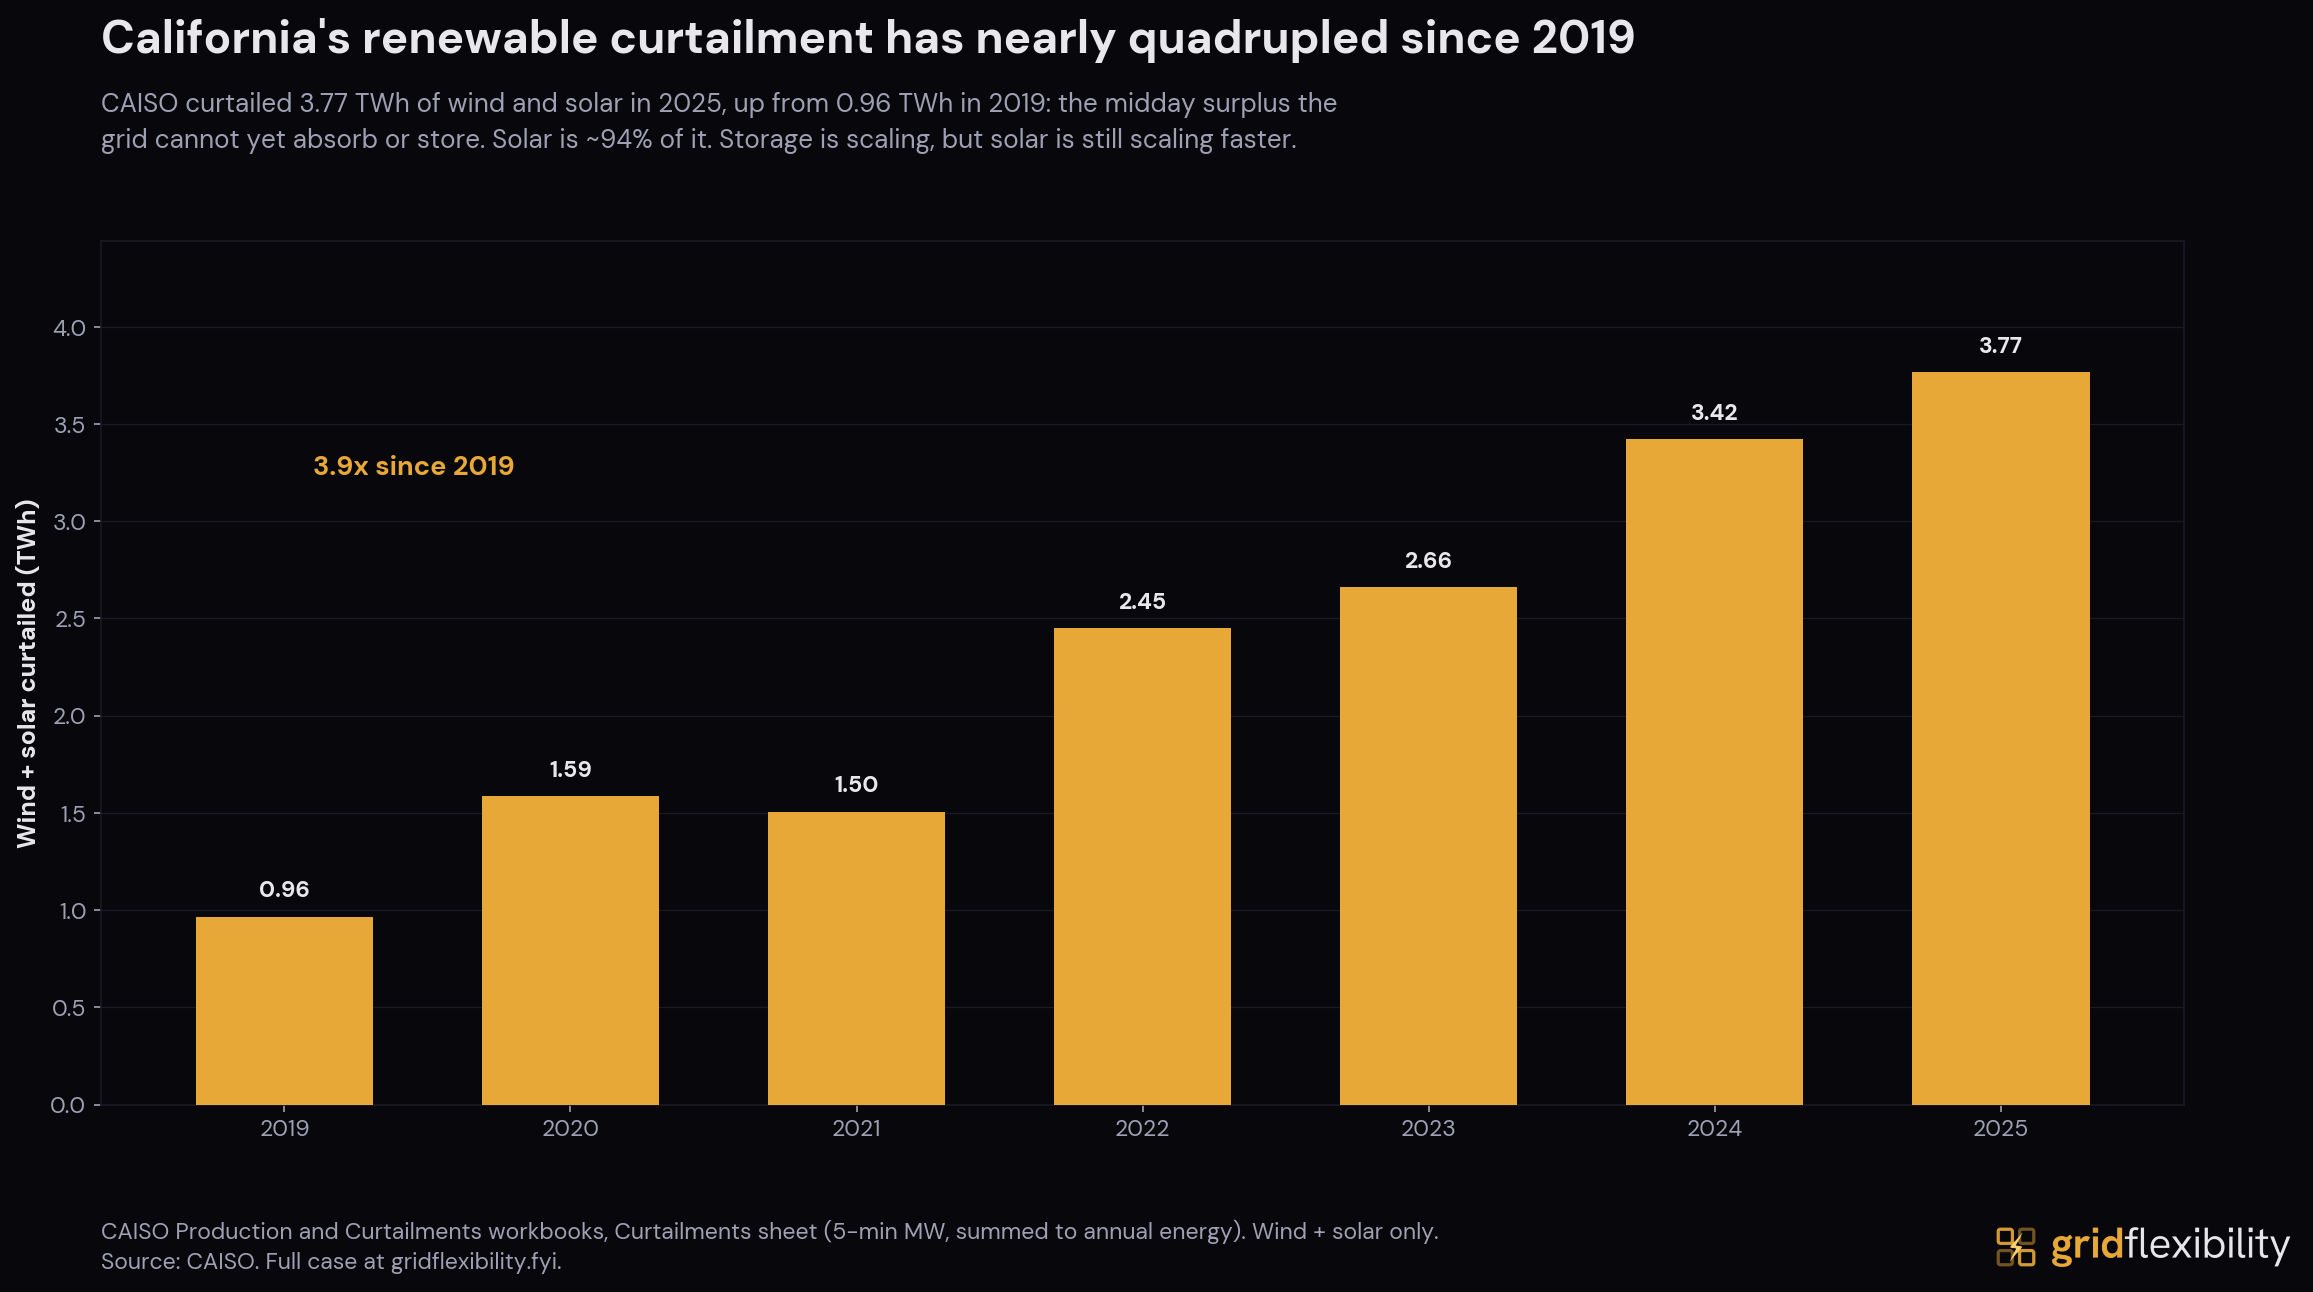
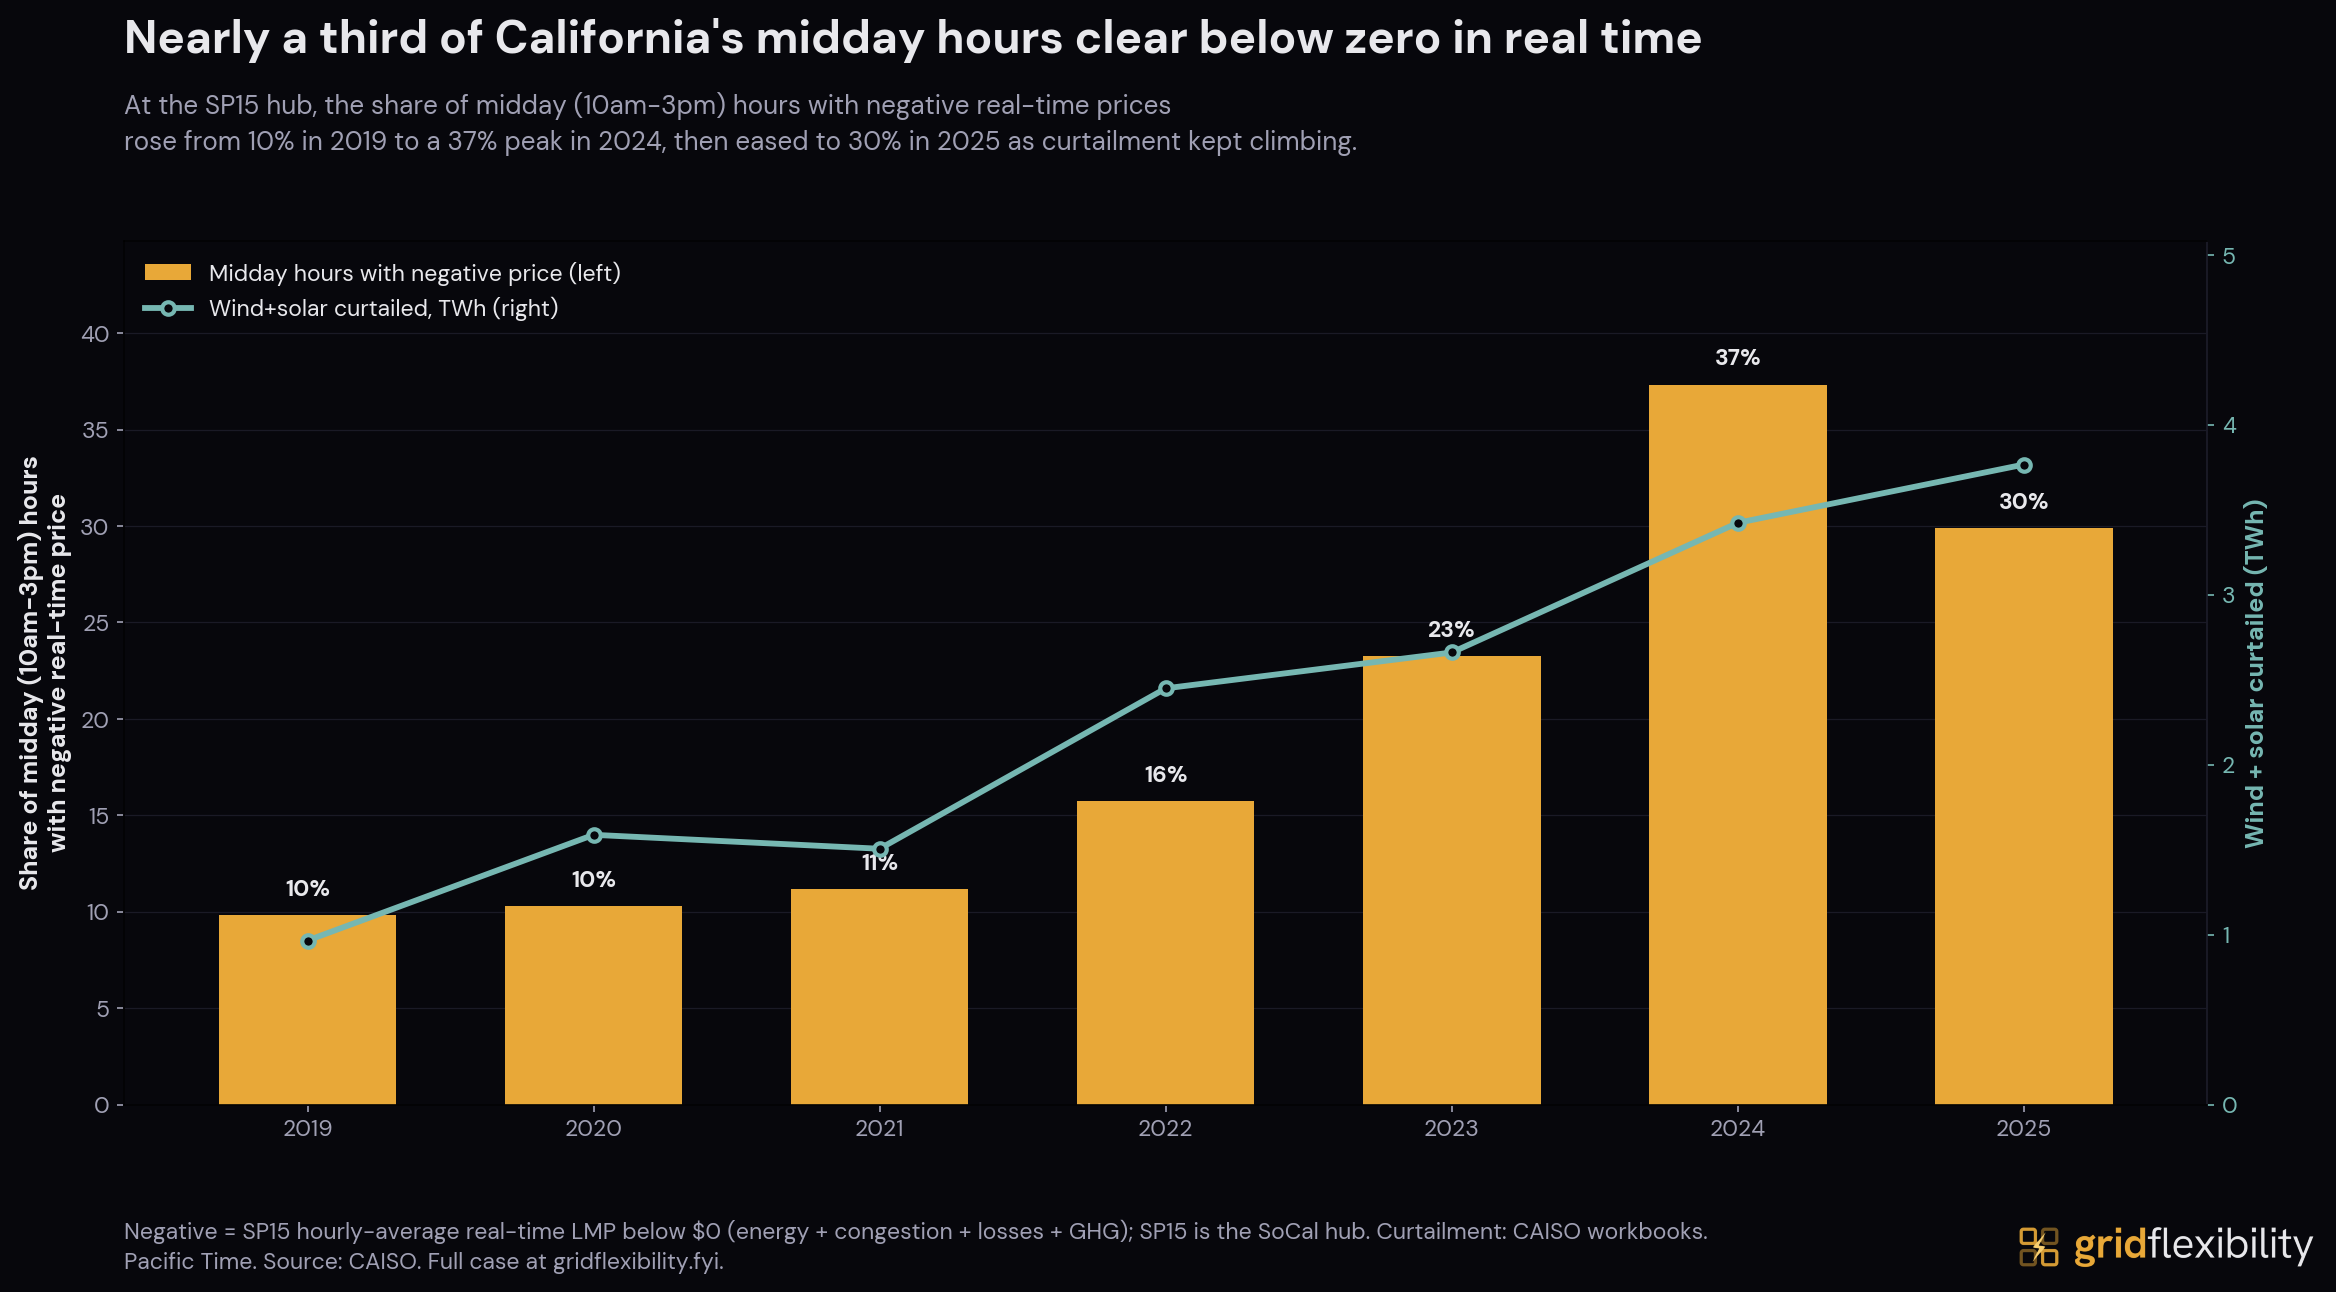
The solar surplus that storage charges against is still growing. CAISO curtailed 3.77 TWh of wind and solar in 2025 (nearly four times the 0.97 TWh of 2019), almost all of it solar. The same surplus shows up in price. The share of midday hours with negative real-time prices rose from about 10% in 2019 to 37% in 2024, then eased to 30% in 2025 as more midday charging lifted prices off the floor.
That is the supply-side record. The next section turns to what the surplus did to prices.
Prices and Bills
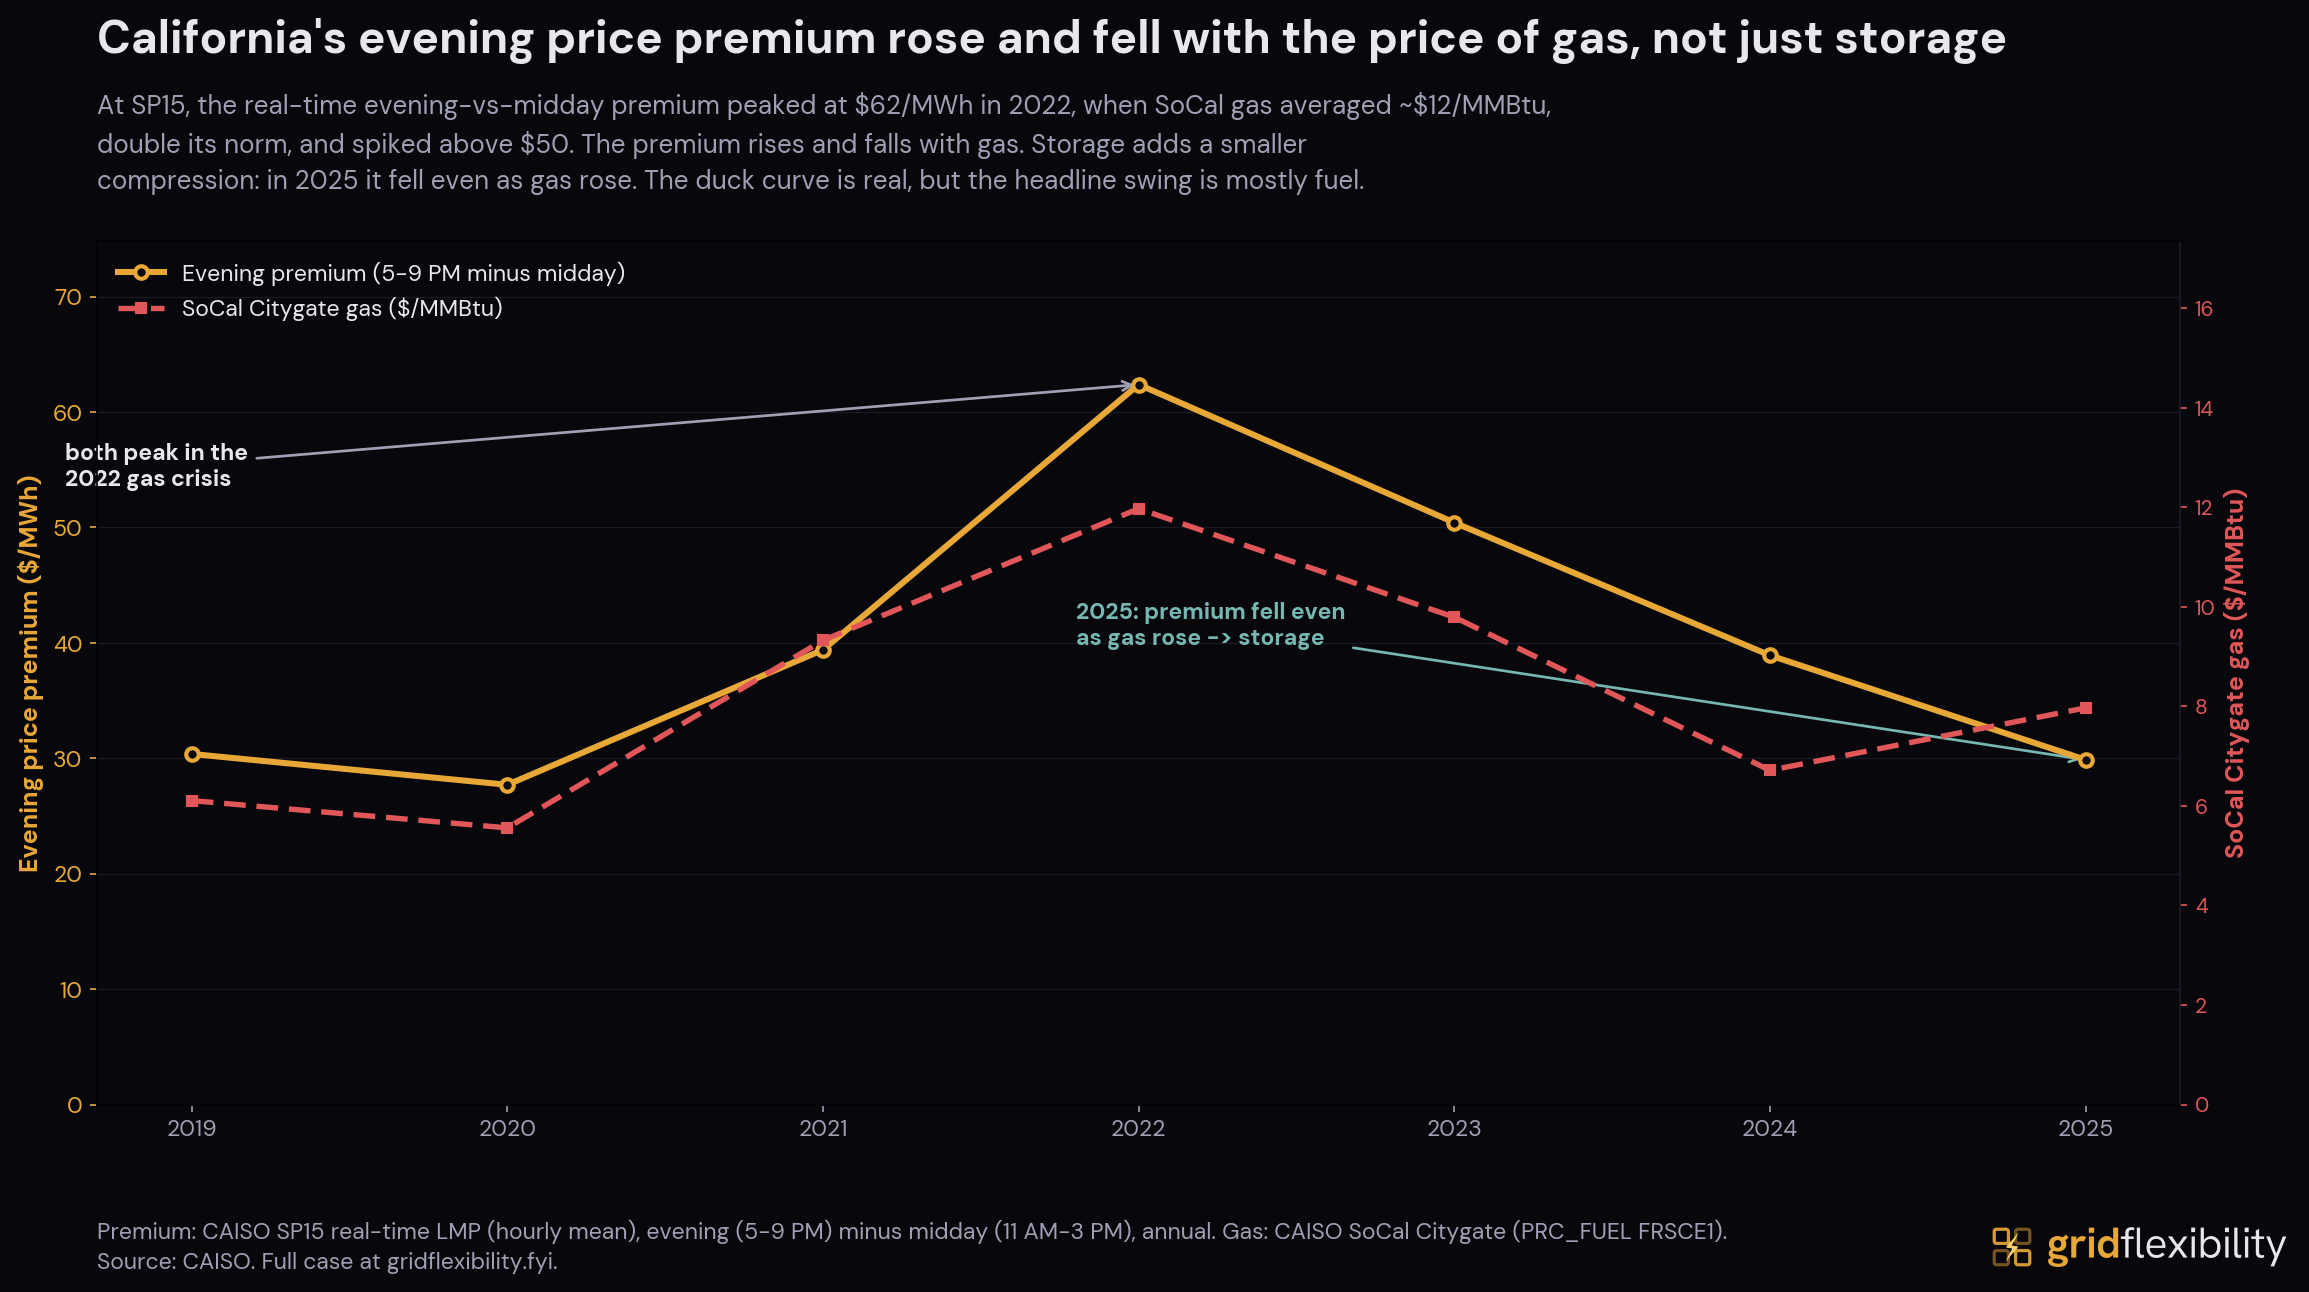
At SP15 (Southern California's wholesale price hub), the real-time evening premium (the 5-to-9 PM price minus the midday price) peaked at about $62/MWh in 2022 and sat near $30 in both 2019 and 2025.
Most of that swing is gas, the fuel that most often sets the marginal price on the grid. The 2022 peak coincided with the SoCal gas crisis, when the Citygate price (normally $5 to $7/MMBtu) averaged about $12 and topped $50 on the worst December days. The premium rises and falls with that fuel price. What gas does not explain is the last stretch. From 2024 to 2025 the premium fell from about $39 to $30 even as gas rose from $6.70 to $8.00/MMBtu. The dominant shaper is the deepening midday solar surplus itself, and the battery fleet monetizes that shape by charging into the surplus and discharging into the evening, shaving the peak it sells into. Storage is one force among several, but it is the change that moved most between those two years, and the dispatch record in the previous section is the direct evidence.
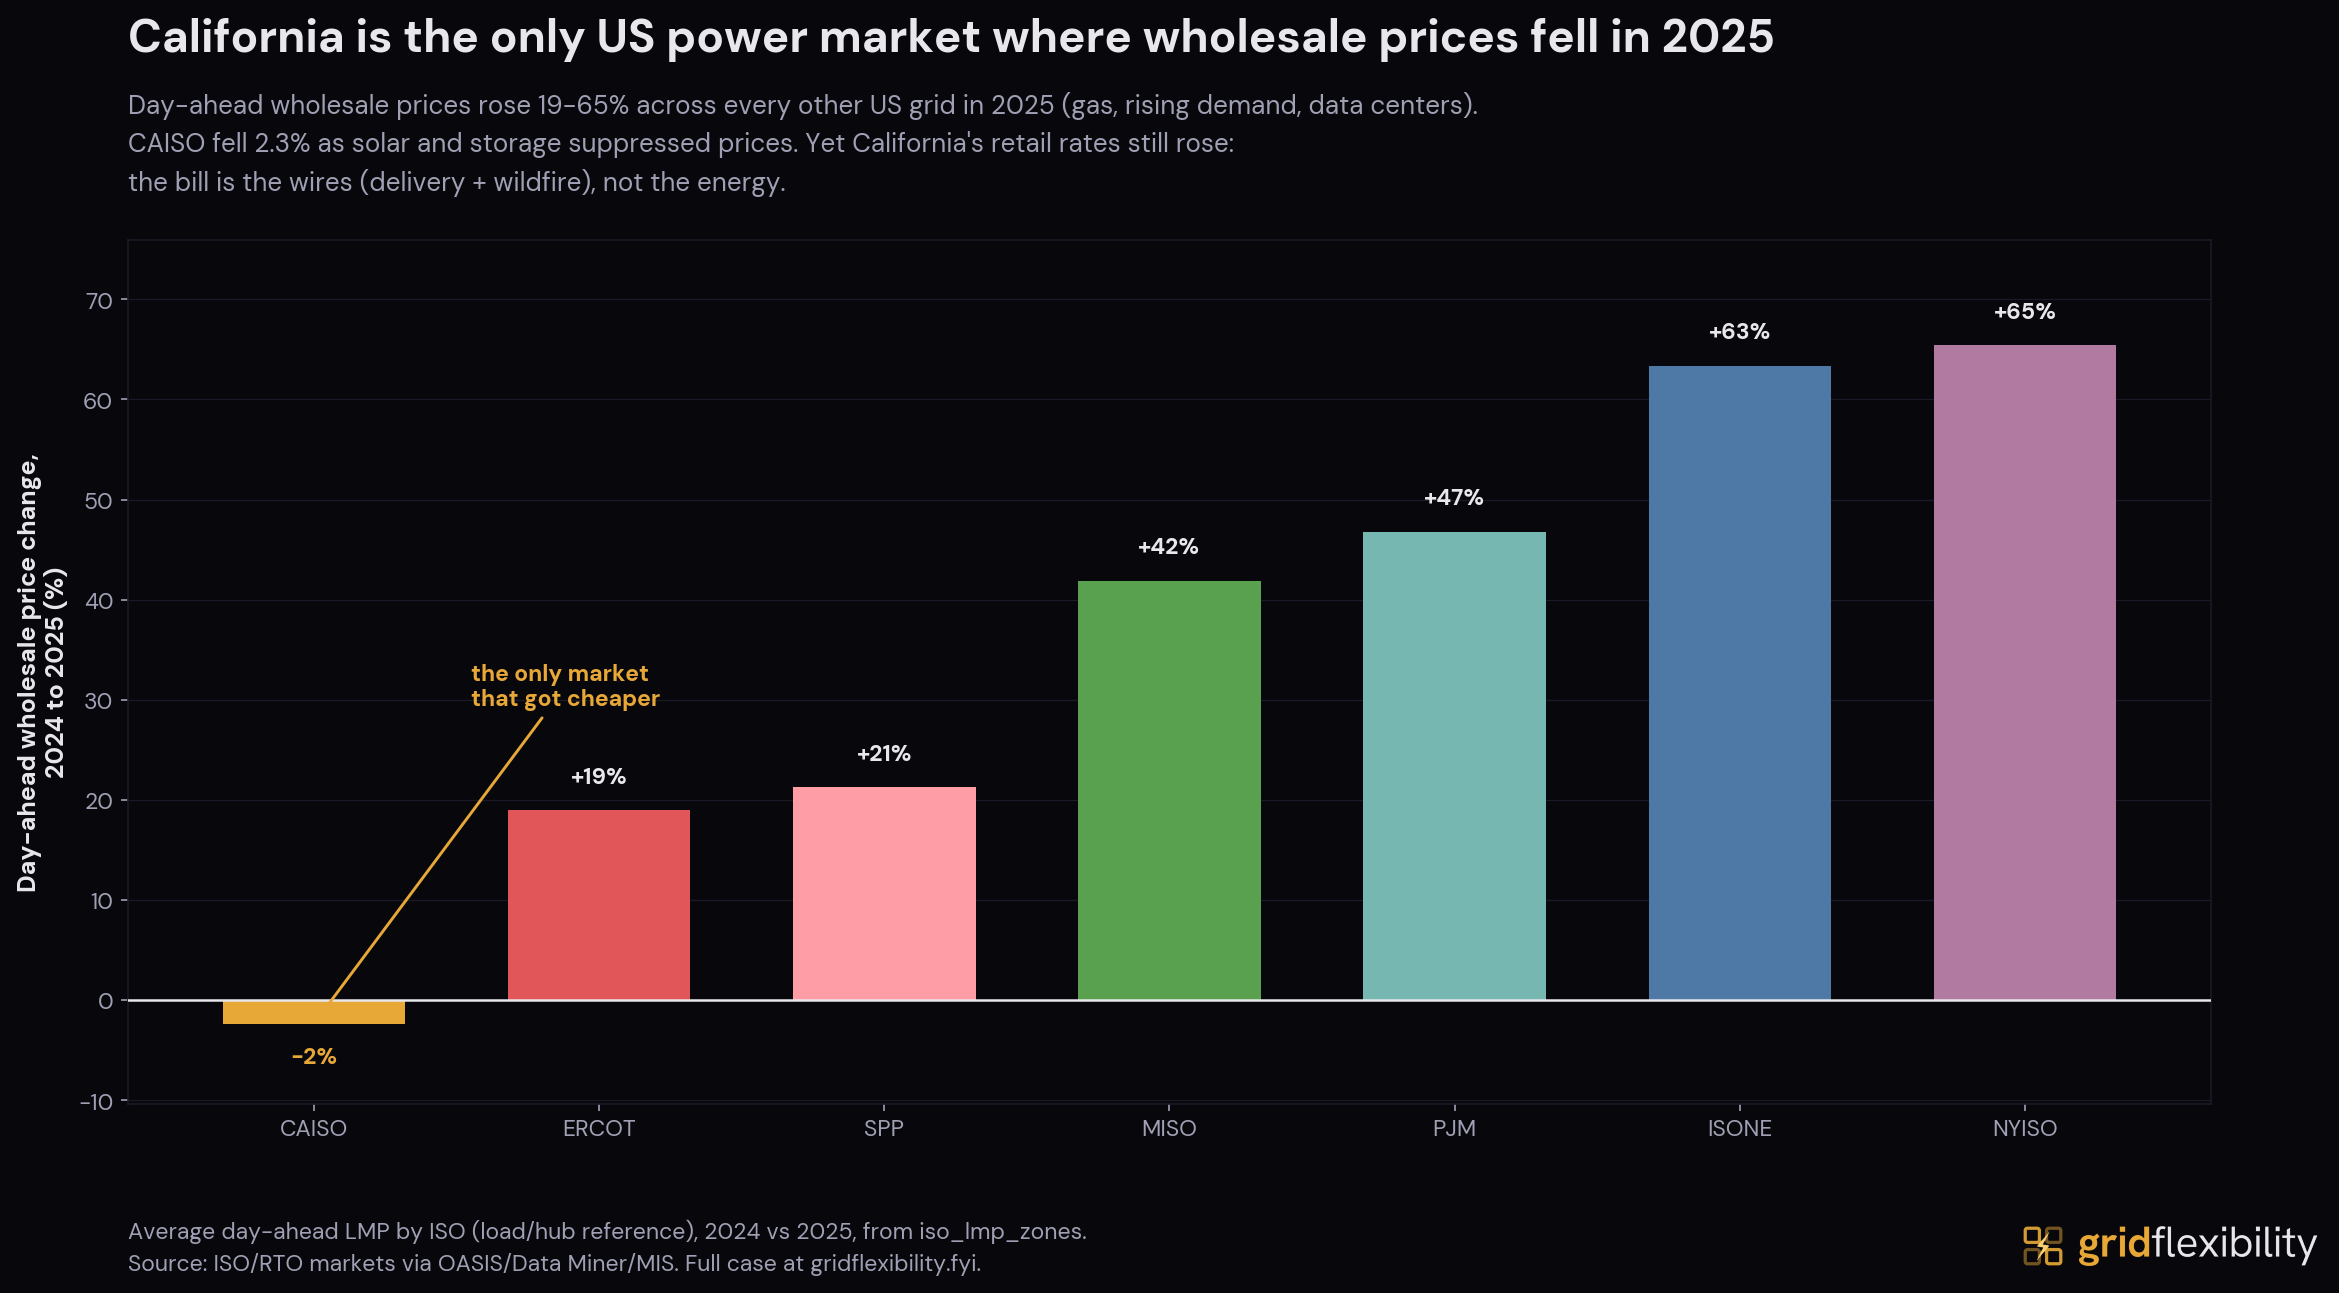
CAISO's prices were unusual in another way. From 2024 to 2025, it was the only one of the seven major US power markets where the average day-ahead price fell. Prices rose between 19% (ERCOT) and 65% (NYISO) across every other grid, on higher gas and rising demand. CAISO's fell about 2%, held down by solar and storage. That comparison is day-ahead. SP15's real-time average rose about 6% over the same two years, as fewer midday hours cleared negative, which is the same easing the curtailment section noted.
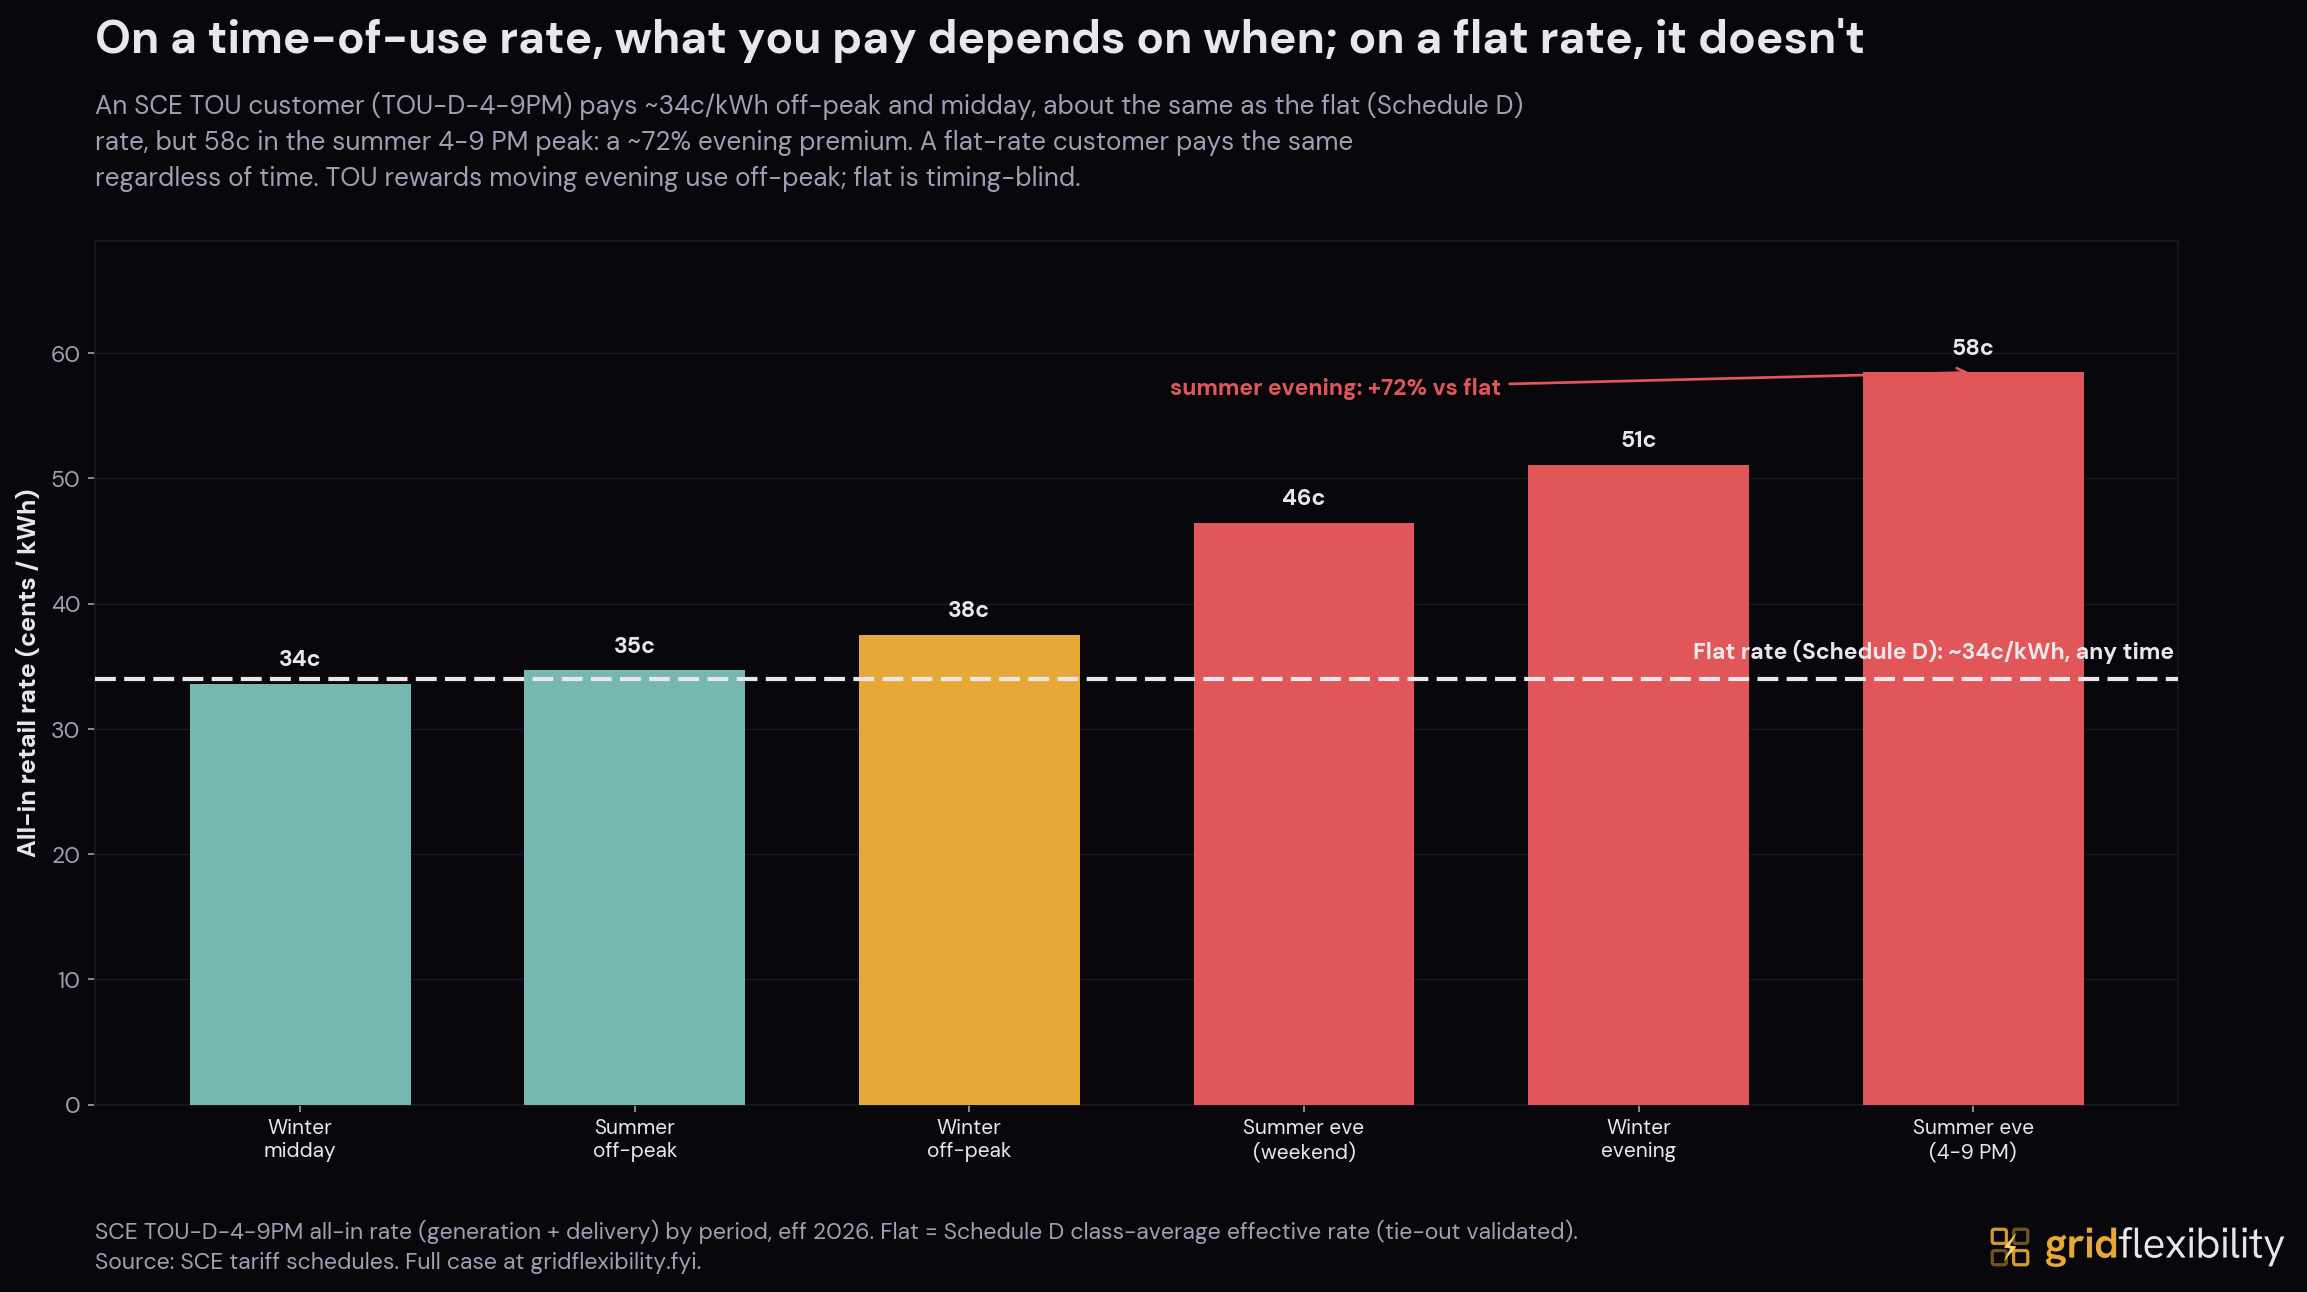
What a customer actually pays is set by the retail rate, which only loosely follows the wholesale price. On SCE's default time-of-use rate (TOU-D-4-9PM), the cheapest hours (off-peak and midday) cost about 34 cents per kWh, matching the flat Schedule D rate. The summer 4-to-9 PM peak costs about 58 cents (72% more).
TOU does not discount midday. It surcharges the summer evening.
For a class-average evening-heavy customer, off-peak and midday prices roughly match the flat rate, so shifting load out of the 4-to-9 PM window narrows the surcharge rather than beating the flat bill. Only using less lowers the bill further.
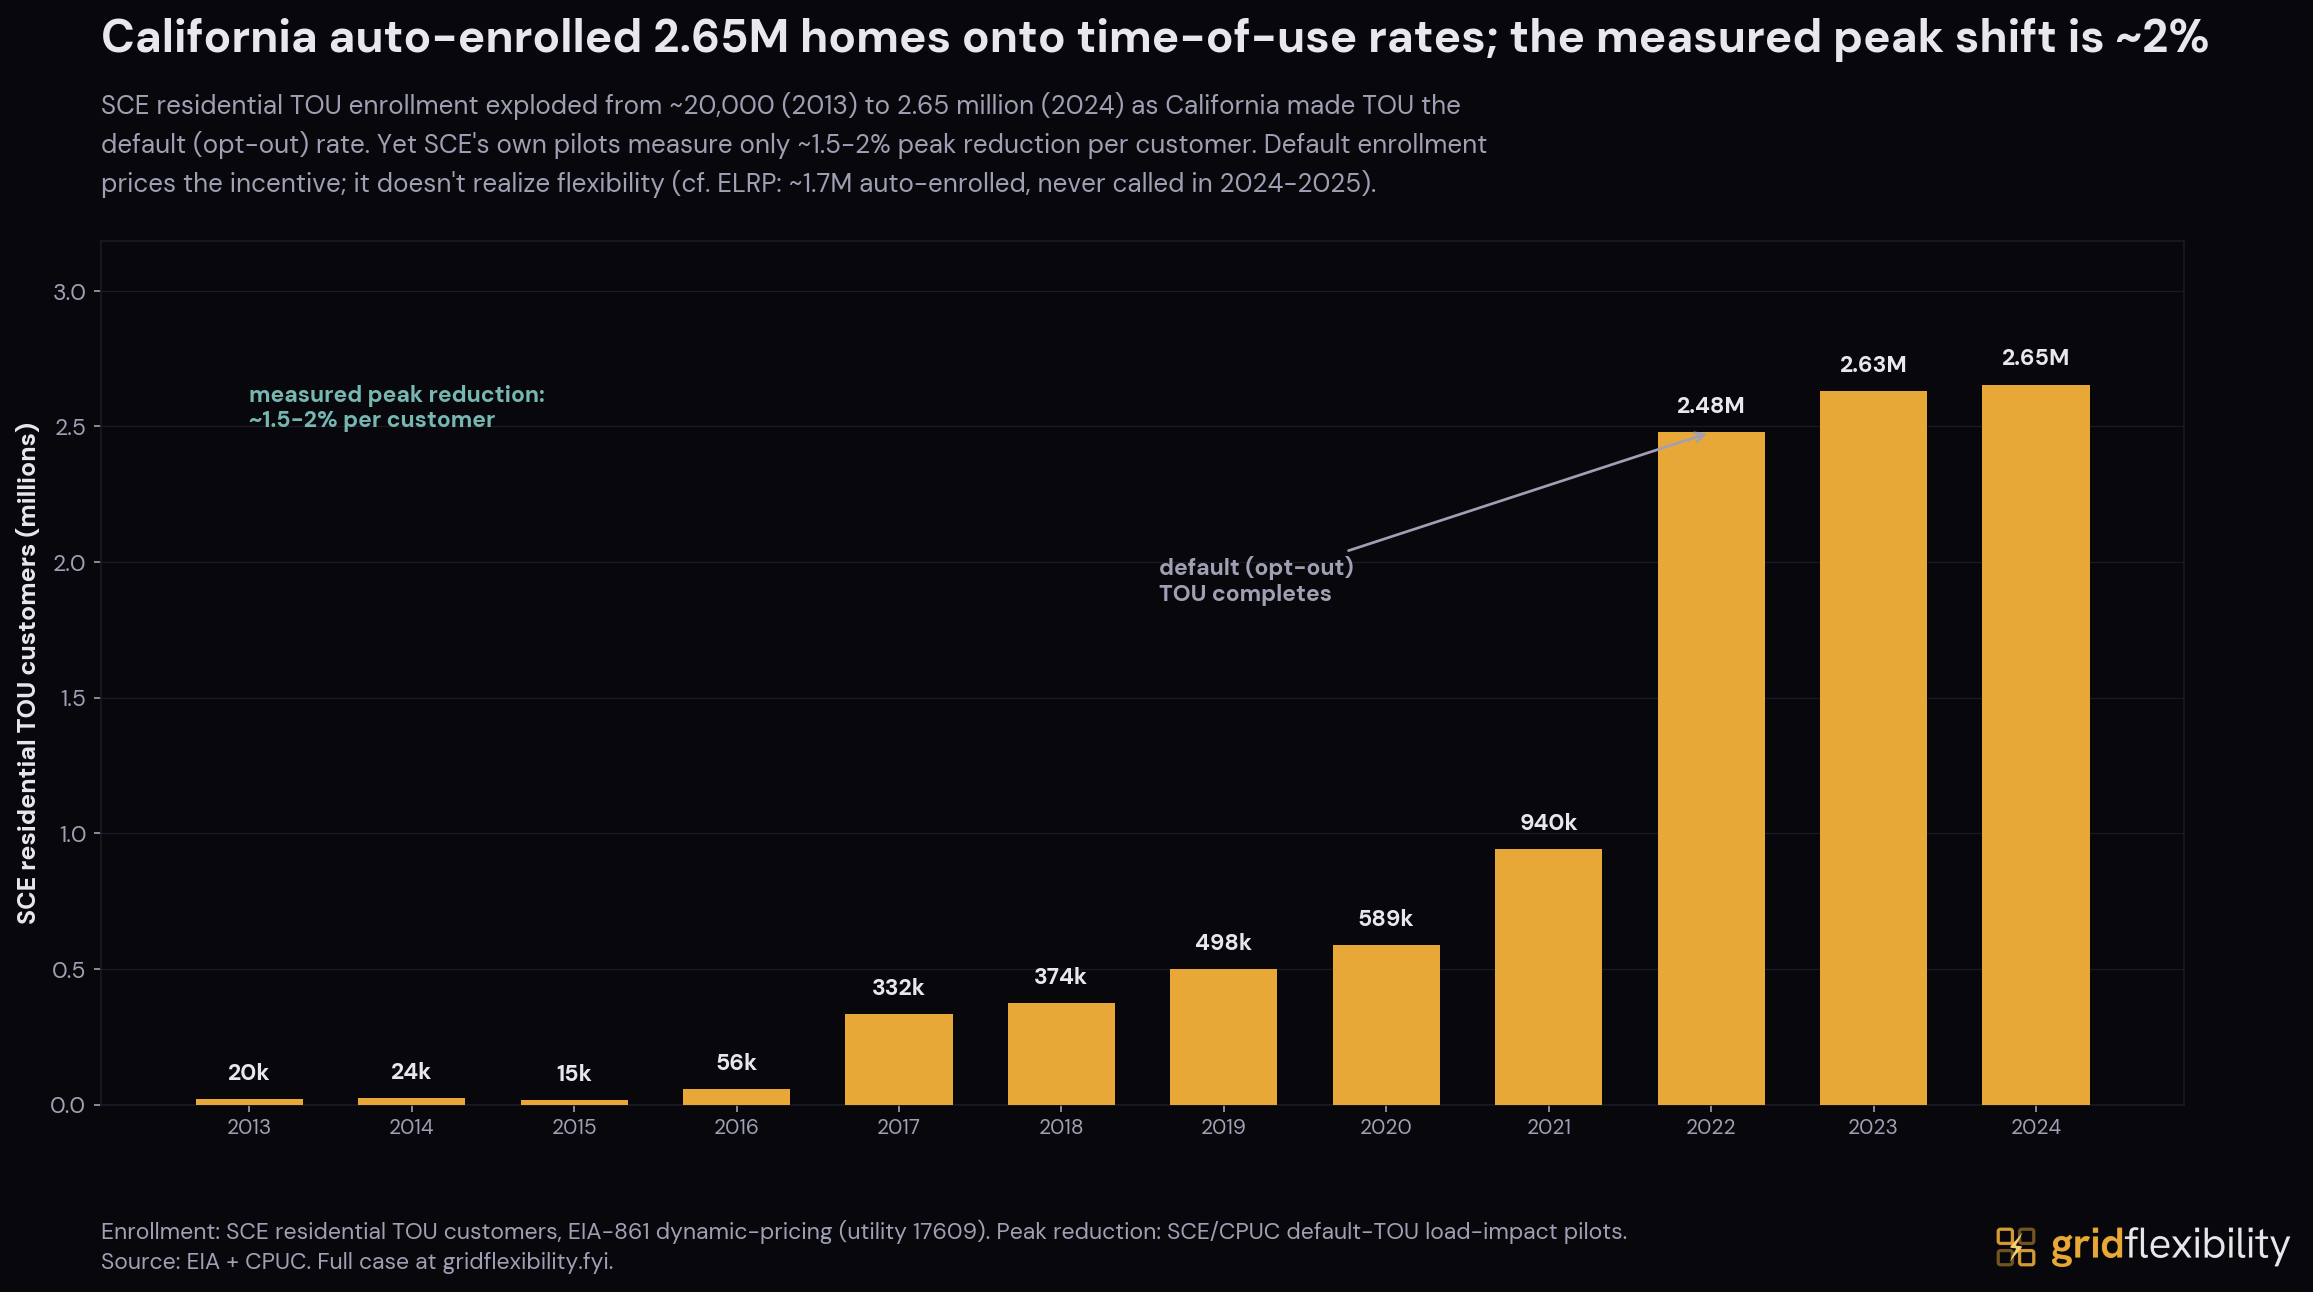
California made that rate the default, in the largest such rollout in the country. SCE residential TOU enrollment rose from about 20,000 customers in 2013 to 2.65 million in 2024 (a 135-fold increase), as the rate moved from opt-in to opt-out. SCE's own default-TOU pilot measured a 1.5 to 2% peak reduction per customer, small but statistically significant.
CAISO's wholesale prices fell in 2025, and SCE's retail bills rose anyway. The wholesale energy price is a small part of the bill, and the next section traces where the rest goes.
Who Pays and Why
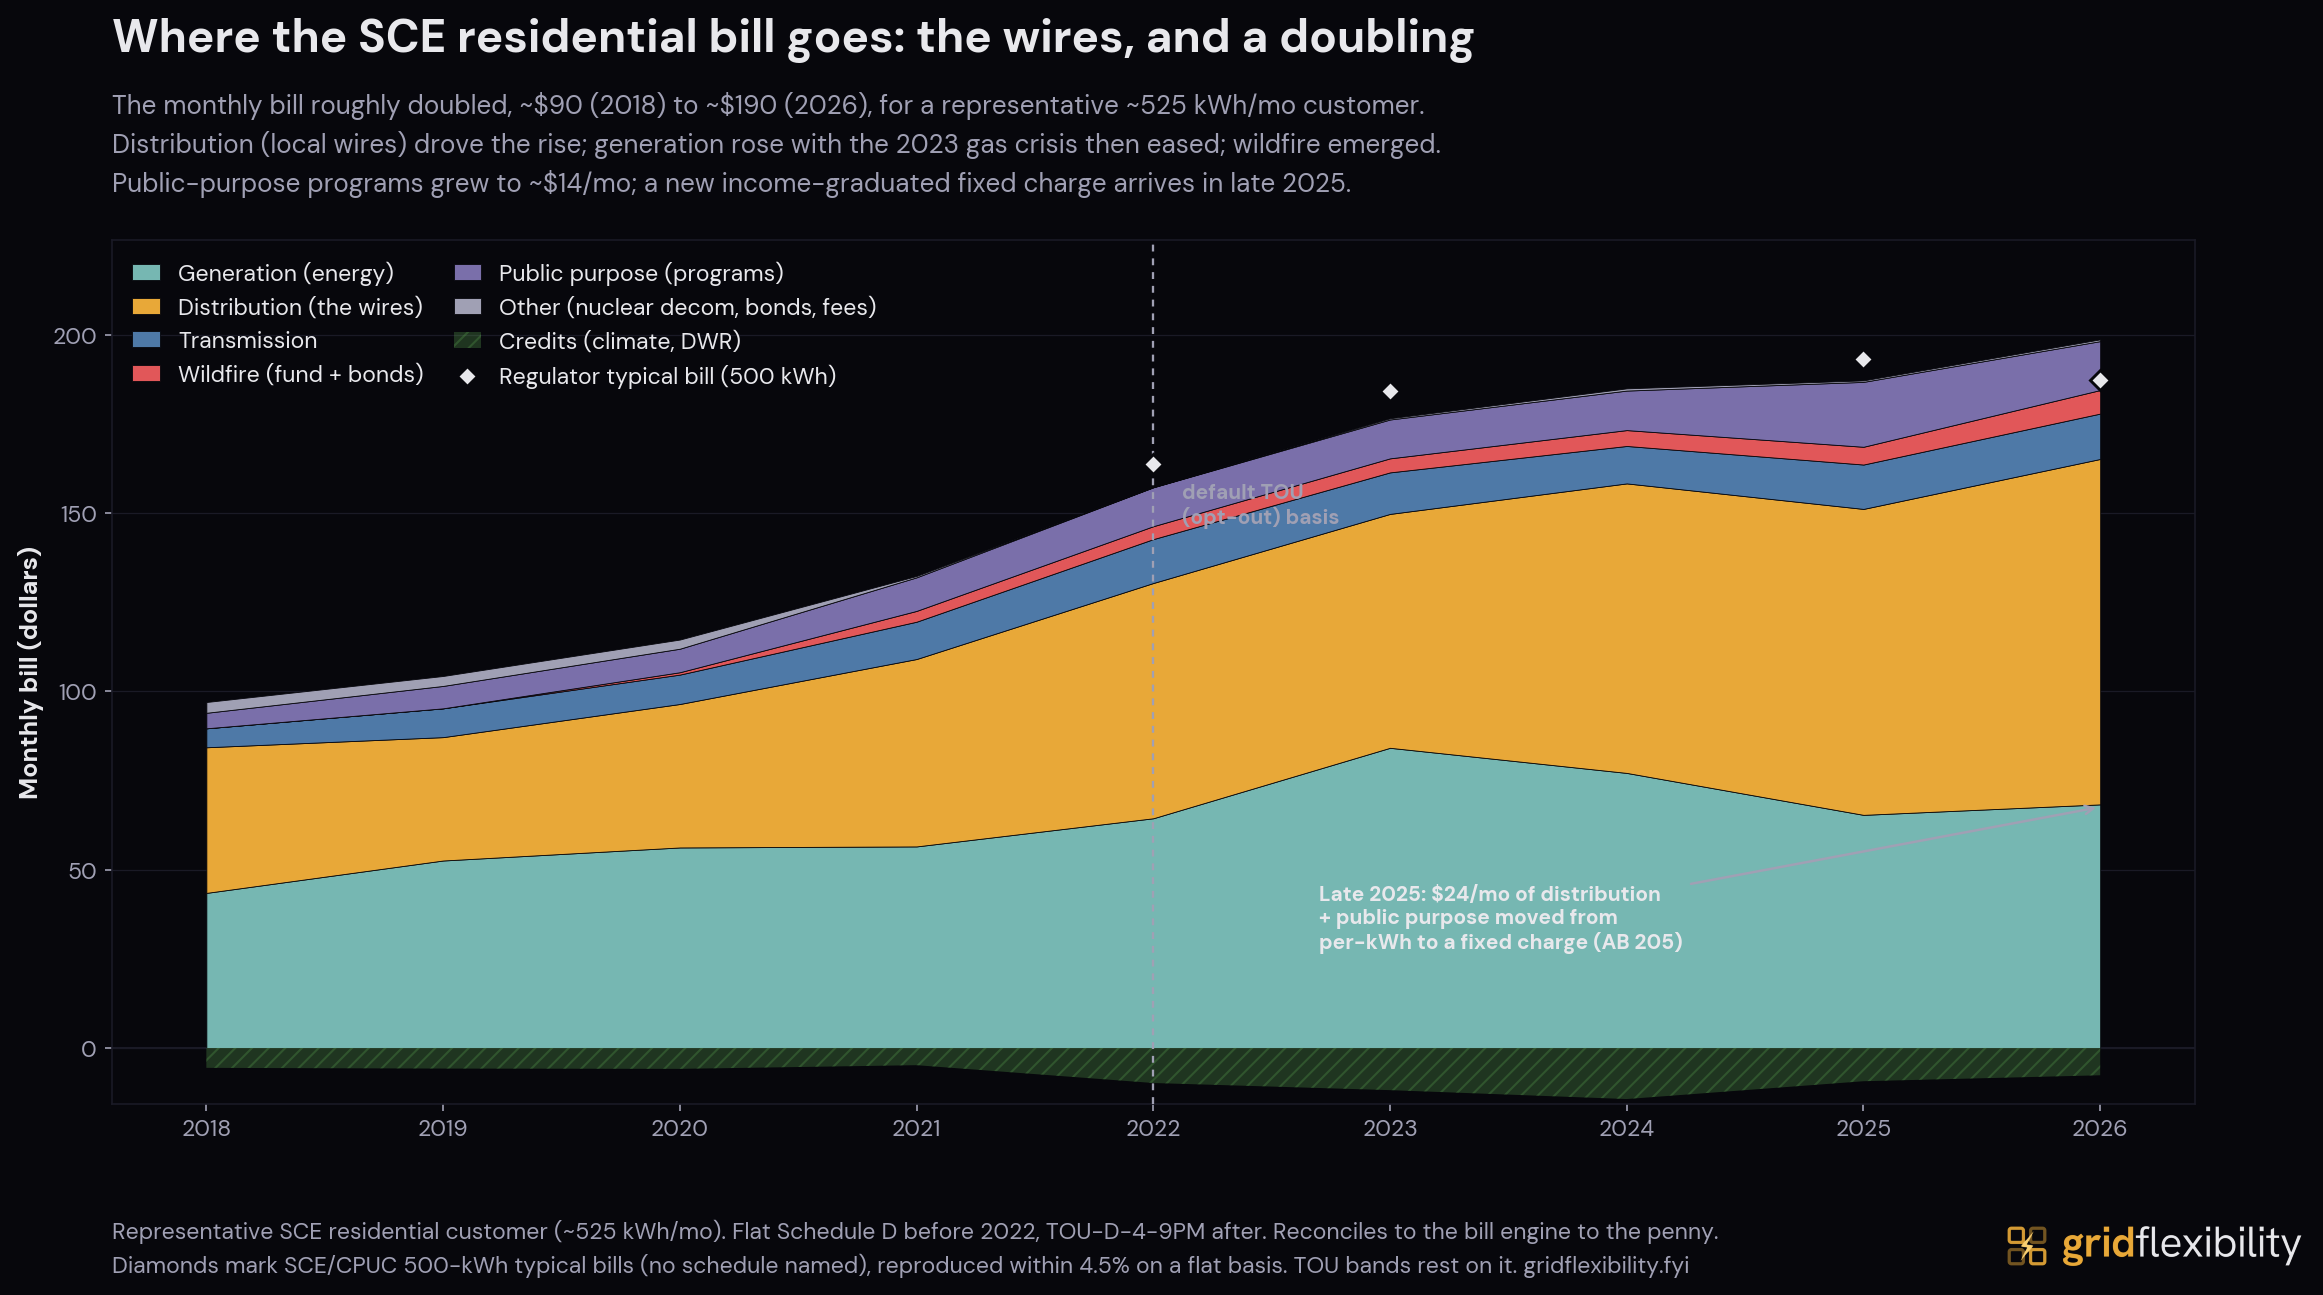
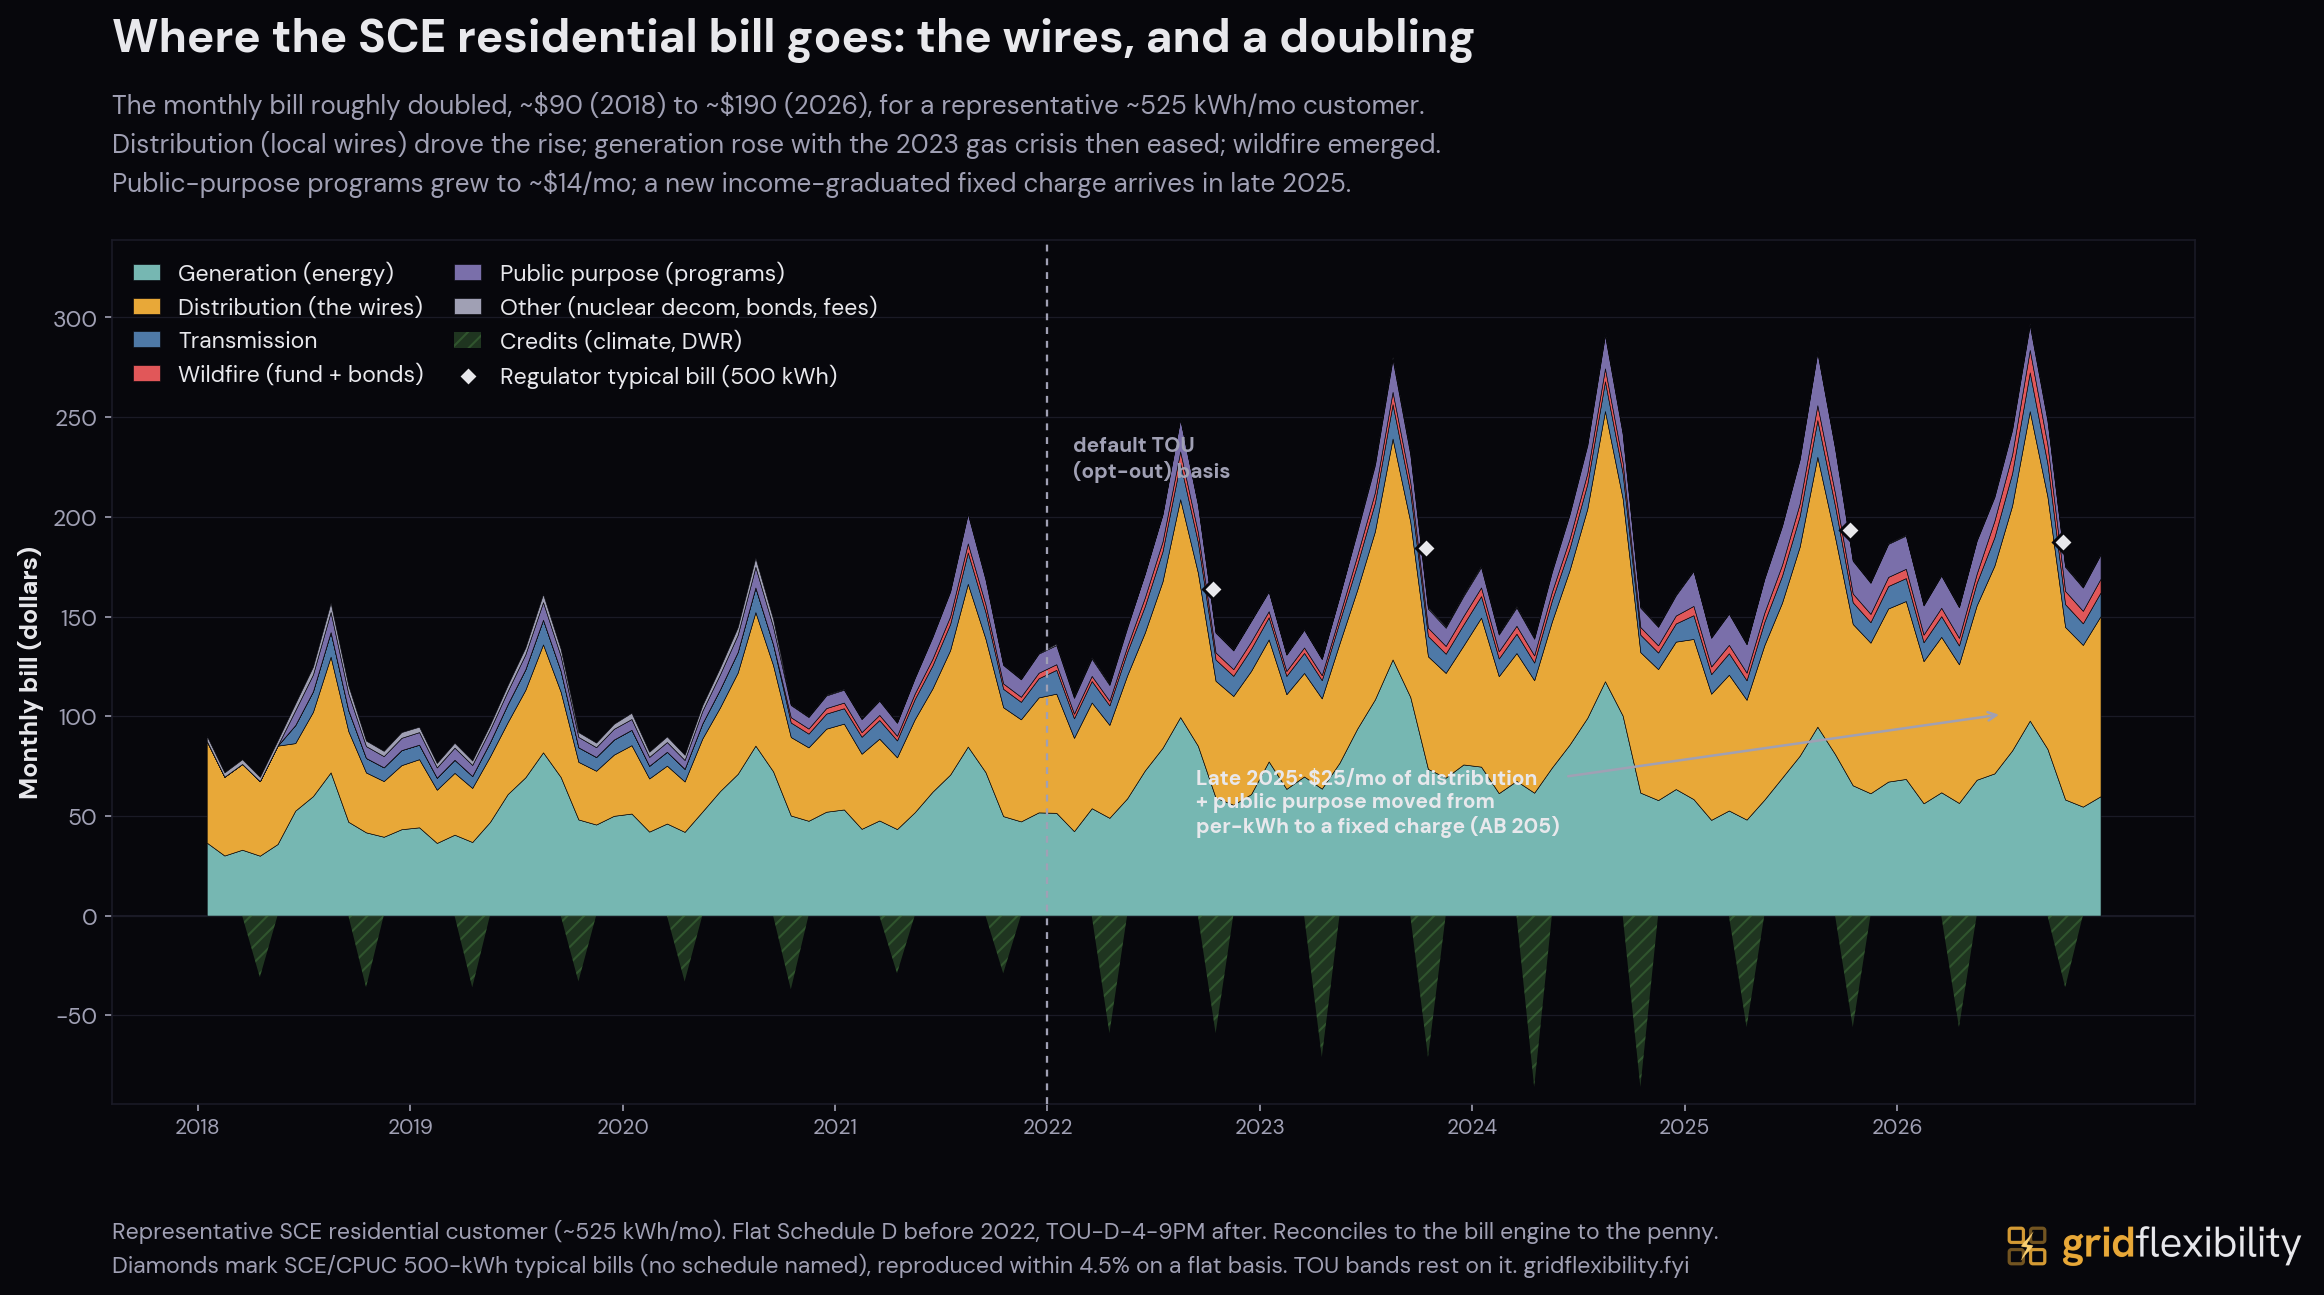
The monthly bill for a representative SCE residential customer roughly doubled between 2018 and 2026, from about $90 to about $190, an average increase of close to 10% a year. The doubling holds on the flat Schedule D rate alone (about 2.1 times), so it is a rate-level story rather than an artifact of the switch to the default TOU rate in 2022. The climb was steepest in 2021 and 2022 (about 16% each year) and ran about 7% over the past year. Almost none of that increase is the electricity itself. The chart breaks the bill into the costs it actually pays for, and the growth is in delivery (the local wires), not in generation.
Generation (the cost of the power) rose with the 2023 gas crisis and then came back down. SCE returned a roughly $750 million generation-rate refund to bundled customers over 2024 and 2025 (citing natural gas and power prices that came in below its forecasts), and generation rates rose again once that refund finished rolling off in October 2025. Delivery moved the other way and dominated. SCE's 2025 general rate case (CPUC decision D.25-09-030) raised its base revenue by about $1.1 billion over prior rates, more than the refund returned. This is why the wholesale price could fall in 2025 while the bill rose. The part of the bill that grew is the part the wholesale price does not set.
Three pieces account for most of the delivery growth. Distribution (the poles and wires that carry power the last mile) is the largest and the steadiest climber. Wildfire charges appeared after 2019 and now run around a cent per kWh as explicit riders, with far more wildfire spending embedded inside distribution itself. And in late 2025 a new fixed charge arrived, moving about $24 a month of distribution and public-purpose cost off the per-kWh rate and onto a flat monthly line.
Who pays is not a fixed group. Since 2018, about 1.2 million SCE residential accounts (more than a quarter of the total) have moved their generation purchase to a Community Choice Aggregator (a local government that buys power on residents' behalf while SCE still owns and operates the wires). Roughly 40% of bundled residential sales left with them (30.3 TWh in 2018 down to 18.1 TWh in 2023). Most of that shift happened in one year (2018 to 2019), as Clean Power Alliance and other aggregators launched across Southern California.
But a CCA only replaces the generation line. The wires belong to SCE, and so do the charges on them. Distribution, transmission, the wildfire riders, public-purpose programs, and the new fixed charge are billed to every account in SCE territory, whether it buys generation from a CCA or from SCE.
Departing customers do not fully exit either. Through an exit fee (the Power Charge Indifference Adjustment) they keep paying for the generation SCE contracted on their behalf before they left, and the customers who stayed carry the same legacy costs inside their bundled rate.
The bill also funds the equity programs. The low-income discount, called CARE, cuts a qualifying bill by roughly a third (about $122 against $193 on the regulator's 500 kWh typical-bill notice). It is funded by a surcharge on other customers, and it reaches about 30% of the state's IOU customers, roughly 1.35 million SCE households in 2024. The new fixed charge is income-graduated by state law, so lower-income customers pay a smaller share of it. Moving cost onto a fixed charge also changes what a household can affect. The more of the bill that sits in a flat monthly line, the less of it a customer can change by using less or by shifting when they use it. The per-kWh rate is the only lever a flexible household has, and the fixed charge shrinks the share of the bill that lever can reach.
The supply side's instruments are funded from these same bills, since the resource-adequacy payments and the mandated storage contracts are recovered in rates. The same customer money could fund demand-side capacity, and a CCA is one entity positioned to buy it. Each CCA is a load-serving entity with a resource-adequacy obligation of its own, and a few have started. Two Northern California CCAs signed ten-year agreements for a combined 12.5 MW of flexible capacity from a marketplace of aggregated customer devices. In SCE's own territory, the largest CCA, Clean Power Alliance (serving about 3 million residents and businesses across 38 communities), already runs the customer-facing pieces, including demand-response and storage-rebate programs and a role in the hourly-rate pilots. No public record yet shows an SCE-territory CCA buying resource adequacy from aggregated customer devices the way the Northern California pair has.
Those agreements total 12.5 MW. The storage mandate was 14.8 GW.
Our Dominion case reaches the same asymmetry from a different load. There, fast-growing data-center demand is billed for the wires it needs; here, growing household demand is billed for the wires too. The load driving the buildout differs, but the planning treatment does not: in both places the process treats supply as something to acquire and demand as something to forecast. Neither yet buys flexibility from its customers at the scale it buys capacity from its suppliers.
The Demand-Flexibility Frontier
The demand-side resources and tools exist. SCE territory has near-universal smart meters, a default time-varying rate, more than half a million rooftop-solar homes, more than a million EVs registered across the counties it serves, and about 147,000 home batteries, most added under the 2023 successor tariff. What is small is the share of all that which is actually activated and dispatched on the evening ramp.
Activation would shift demand into the midday surplus the grid now curtails and out of the 4-to-9 PM climb the battery fleet serves. Demand flexibility does not displace the batteries. It is another tool in the same portfolio, one that stretches the fleet further and grows with every EV and home battery added behind the meter.
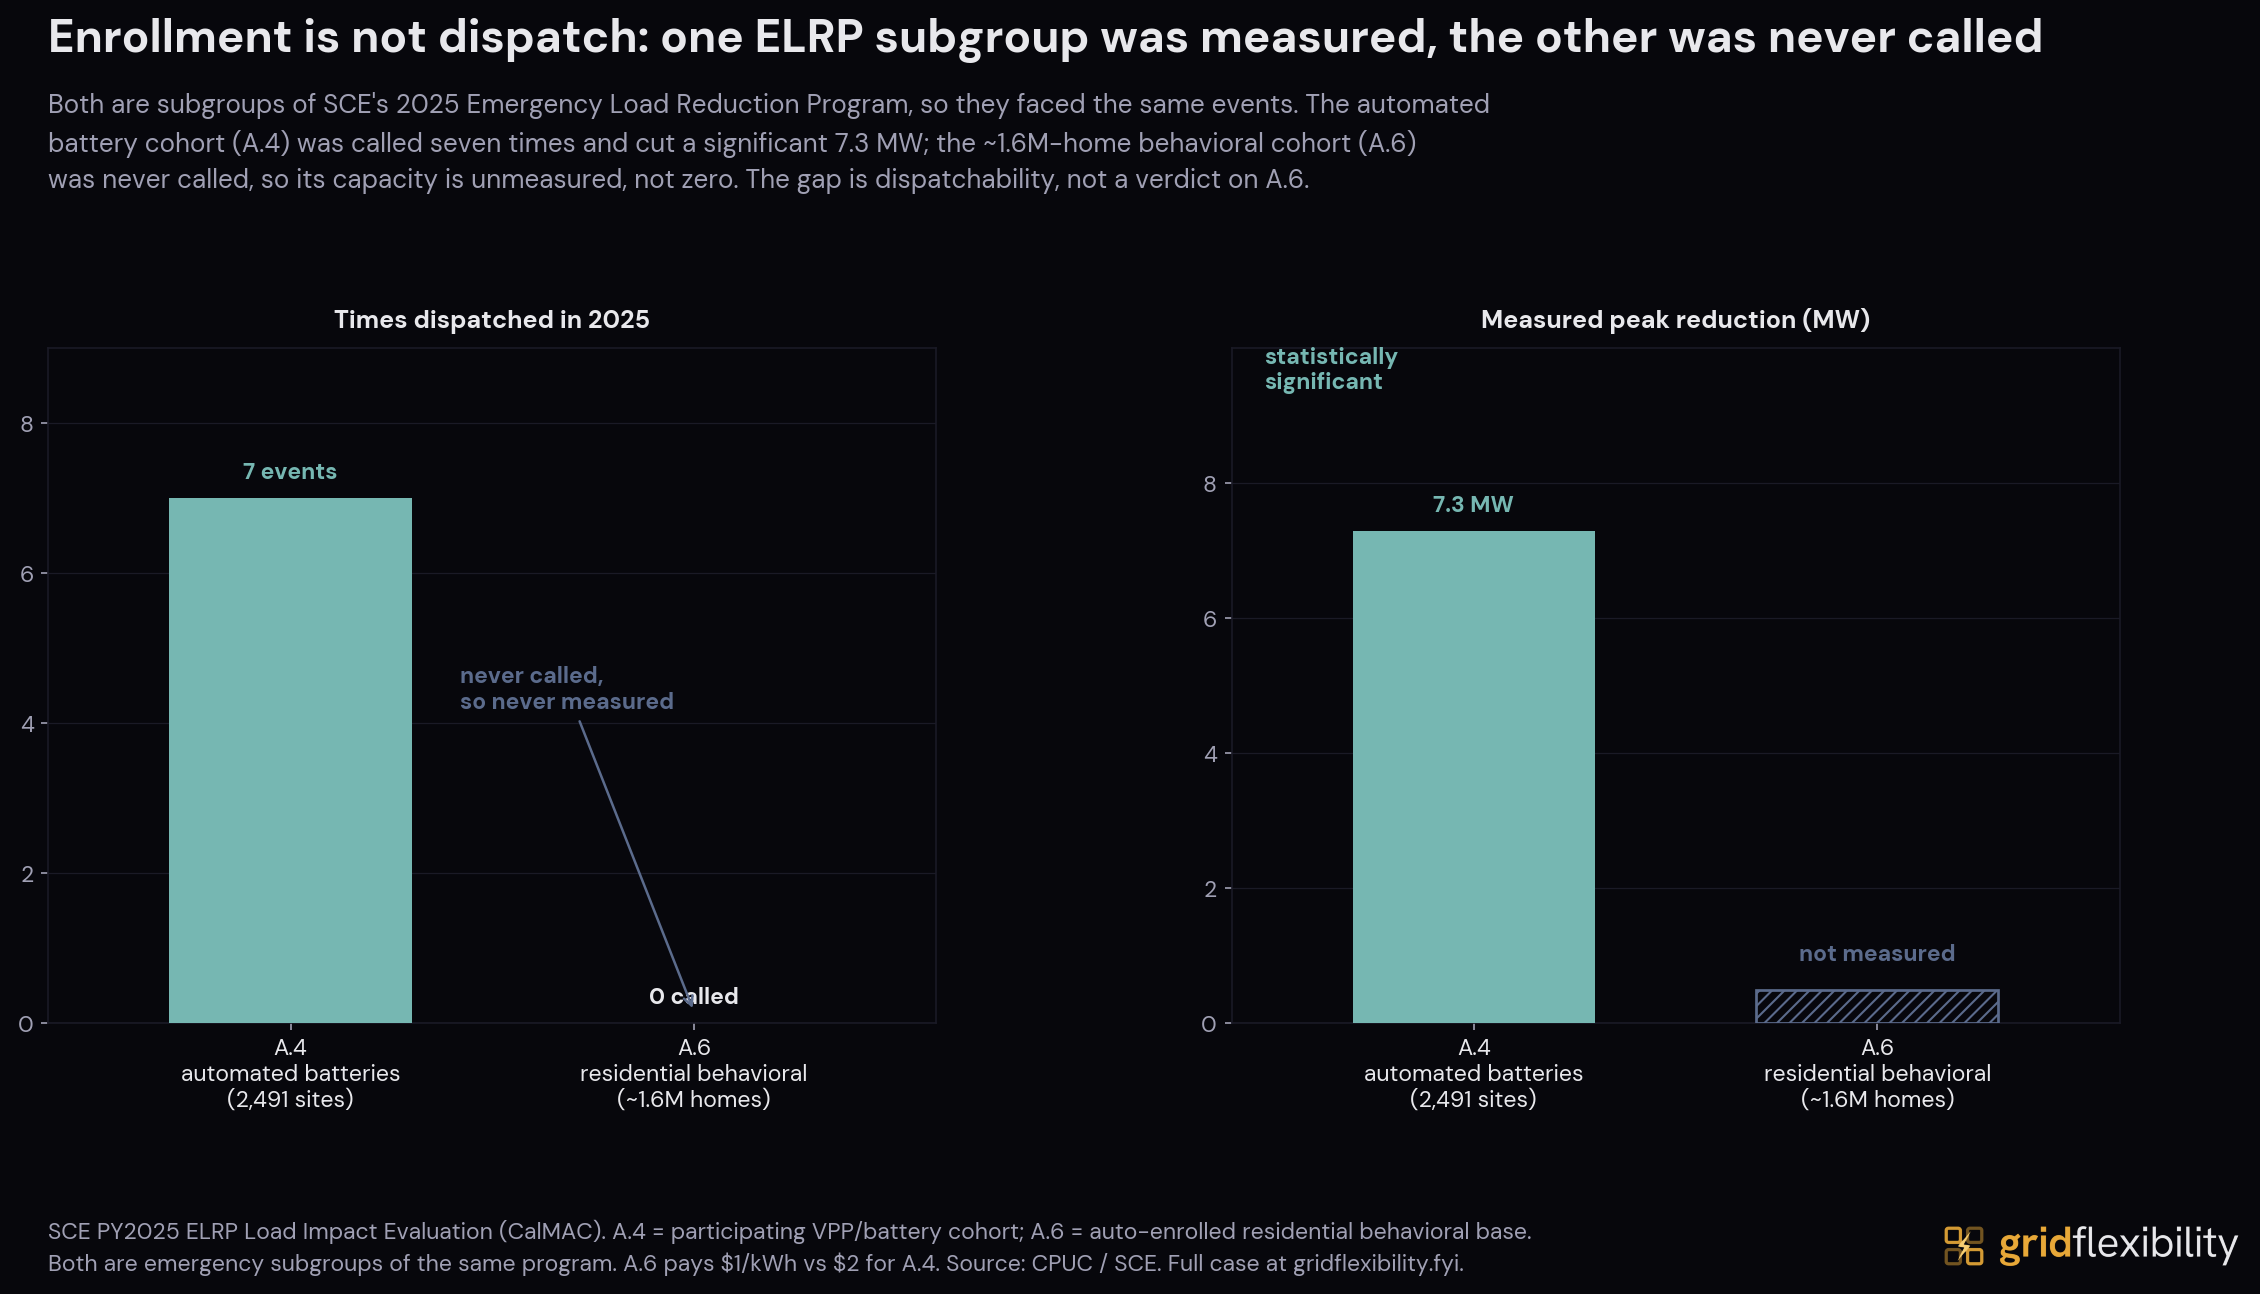
The state's emergency flexibility program, the Emergency Load Reduction Program (ELRP), a pilot created after the 2020 outages, produced both results in 2025. The part that delivered was the Virtual Power Plant path (the program's A.4 group, where aggregators dispatch customers' solar-paired batteries automatically). About 2,500 of those sites were called seven times and cut 7.3 MW, a clean and statistically significant reduction. The part that did not was Power Saver Rewards (the mass residential behavioral program, group A.6, about 1.6 million enrolled households). It was not called at all, even the behavioral groups that were dispatched produced no meaningful reduction, and the program was sunset at the end of 2025.
Automation and aggregation delivered. Enrollment alone did not.
Manual behavioral response has a low ceiling, consistent across A.6 and the dispatched behavioral groups. The demand-side resource that competes with a grid battery is an automated, aggregated fleet of devices, the kind A.4 dispatched.
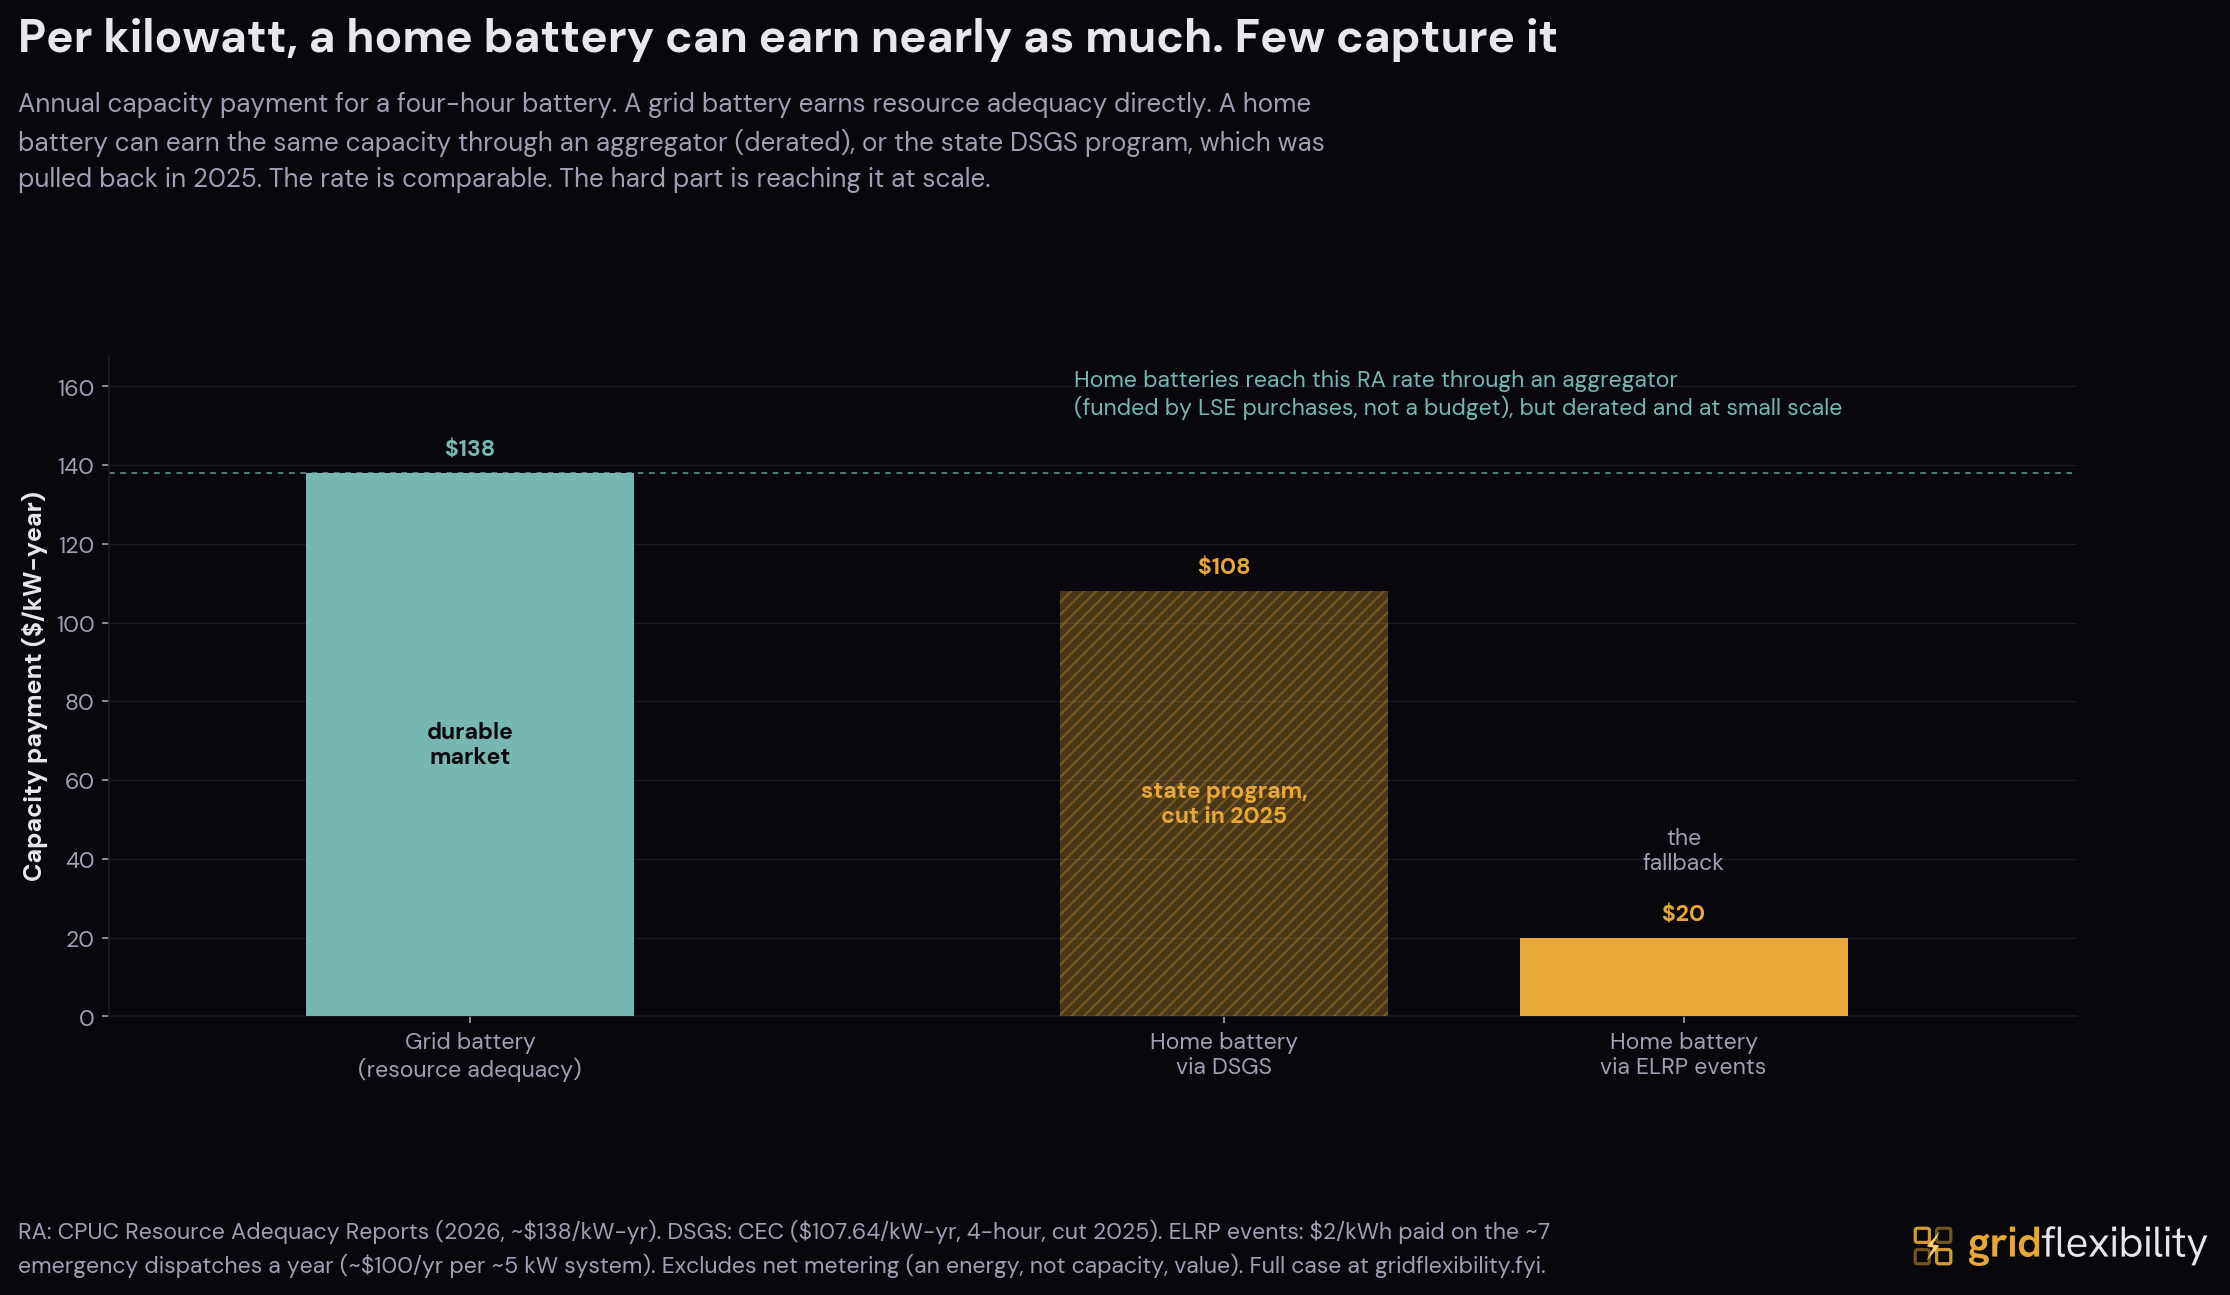
The compensation is uneven, and one battery makes it concrete. A typical 5 kW home battery in SCE's emergency program earns $2 for every extra kWh it sends back during an event, roughly $16 per call and about $100 across the seven or so events a summer brings. Committed instead to the state's Demand Side Grid Support program as capacity, the same battery earns about $540 a year (5 kW at about $108 per kW-year), close to the roughly $138 per kW-year a grid battery earned from resource adequacy in 2026. The dollar figures are our arithmetic on the posted rates. The per-kilowatt rates are comparable. The difference is durability. That capacity payment comes in two forms. The durable form is resource adequacy: an aggregator sells the capacity to a load-serving entity (a utility or a CCA) to meet that entity's RA obligation, so it is funded by ratepayer RA purchases rather than a year-to-year state budget. The fragile form is the state's DSGS program, whose funding was cut back in 2025. Which one scales is a question the What to Watch section returns to.
The broader wholesale energy market is open to those batteries too. CAISO completed its FERC Order 2222 compliance in November 2024, on top of a distributed-resource market it had run since 2016, and dropped the minimum aggregation size to 100 kW. An aggregator can bid a fleet of home batteries, EVs, and thermostats into the wholesale energy and ancillary-service markets. Capacity is more complicated, but it is not absent. Some behind-the-meter resources lower RA obligations by lowering the forecast. Utility demand response is credited by subtracting capacity from the utility's RA requirement. And third-party aggregators can sell demand-response capacity to load-serving entities as supply-plan RA through CAISO's proxy-demand-resource (PDR) participation model. That last lane is the closest analog to direct aggregator capacity procurement. In the most recent public accounting, the summer of 2024, demand response met about 1.4 GW of California's resource-adequacy capacity, about 2.6% of the system total (down from roughly 3 to 4% in the prior four summers, partly because the CPUC removed the planning-reserve-margin and transmission adders it had applied to utility demand response, a methodology change rather than a like-for-like loss), and roughly 255 MW of that was third-party supply-plan demand response. How much of it is home batteries, rather than traditional load curtailment, is not something the public data reveals.
The Virtual Power Plant path above uses that third lane. The constraints on it are scale and transparency, and The Pattern's capacity-books chart shows the scale side. Assembling capacity from many small batteries, each signed up and dispatched through an aggregator, is slower and more piecemeal than ordering it from a handful of large projects. The utility reviews each aggregation (a resource cannot be paid twice for the same service), and the residential VPPs enrolled through SCE's own programs are still a few thousand sites, against about 147,000 home-battery installations and more than four million residential accounts in the territory.
The same logic extends to EV charging. The EVs driving SCE's load growth are batteries on wheels, and their charging is the most shiftable load in the territory, which makes the evening-ramp problem substantially a charging-timing problem. The dispatch machinery for them is younger and smaller still. SCE's managed-charging pilot launched in July 2025 with a target of 3,000 drivers, and the one EV lane in SCE's evaluated demand-response portfolio (the ELRP vehicle-grid-integration subgroup, where Ford participates through an aggregator) ran about 70 sites in 2025, with a forward estimate below half a megawatt.
The pieces are in place at small scale. What is missing is procurement at that scale. Doing for demand what California did for storage means three things the supply side had: a target that brings capacity into service, a capacity payment on an accreditation the resource can meet, and a funding source that does not lean on a year-to-year state budget. For the demand side, the first is a lower bar than the one the supply side cleared, because most of the fleet is already installed. The million-plus EVs and 147,000 home batteries above do not need to be built. They need to be enrolled, aggregated, and dispatched. The demand side has partial versions of the second and third through the RA lanes above, and an LSE RA purchase is more durable than a year-to-year state program. The first exists only as a goal. The state's load-shift target, covered in What to Watch, carries no procurement obligation. The CPUC does not order home-battery capacity enrolled and bid the way its storage decisions ordered grid batteries built and bid. Whether California adopts such an order is the question the rest of this case tracks.
What to Watch
Five markers indicate whether these pieces scale: one builds the fleet, one sharpens the signal, one is the funding that decides whether the resource gets procured at all, one is the target the state has already set, and the last is the demonstrated response.
The first marker is home-battery attachment. Storage attachment on new residential solar jumped from about 11% of installs to about 76% after April 2023, when the Net Billing Tariff (NEM 3.0, CPUC decision D.22-12-056) replaced net metering's full-retail export credit, the 1995 instrument on the supply ladder above. The new tariff credits exports at the state's Avoided Cost Calculator, an hourly value set by what the power is worth to the grid that runs well below retail and bottoms out in the oversupplied midday. That cut the average export credit by roughly three-quarters, cut it hardest in the hours solar exports most, and made storing the midday surplus for the evening the economic default. The redesign also slowed new solar-only installs, so part of the higher attachment rate is a smaller denominator rather than only more paired systems, but the paired systems are the ones that add a grid-capable battery. Each of those batteries can enroll in a VPP. NEM 3.0 is one of two production lines for the home-battery fleet the rest of this case depends on. The other is resilience. In a state where utilities de-energize lines to prevent wildfire, a battery is bought as backup power first and a grid resource second. Neither purchase is contracted as grid capacity, so the attachment rate measures how fast the unbought fleet is growing.
The price signal is sharpening. California's Load Management Standards (CEC docket 23-LMS-01) require the large utilities to offer an optional hourly rate tied to the wholesale price by 2027. That is the rate that lets a battery or a smart device chase the evening premium directly, rather than the blunt peak-versus-off-peak split TOU offers today. Whether households respond to a sharp price on their own, or only when a device acts for them, is the open question. SCE is running a dynamic-rate pilot to test it, and the residential results are not yet public. The nearest California evidence, an agricultural pilot on a similar dynamic rate, found that automated response helped but that manual, day-to-day response was mixed. Consistent with the ELRP result above, automation mattered more than the price by itself, though the residential answer is still open.
The third marker is the funding, and it resolves in 2026 and 2027. The capacity payment that does the doubling, DSGS, runs on state funds. California pulled back its funding in 2025 and narrowed participation for 2026. The Governor's budget proposal zeroes it out for 2027, directing the CEC and CPUC to move its customers into ELRP or an equivalent program. ELRP's own funding runs only through the end of 2027, and its successor is being decided now in the CPUC's demand-response rulemaking (R.25-09-004), with a proposed decision on 2028-2029 bridge funding expected in late 2026. One program is the proposed landing pad for the other, in the same window both funding questions come due. For scale, an April 2026 legislative analysis put DSGS enrollment near 1,145 MW against roughly 190 MW in ELRP. A sharper rate and a bigger fleet do not procure anything by themselves, and the durable route that remains, resource adequacy through an aggregator, scales one contract at a time.
The fourth marker is the closest thing California has to a demand-side target. SB 846 required the CEC to set a load-shift goal, and in May 2023 the commission adopted one: up to 7 GW of load shift by 2030. It is a goal rather than a procurement. No purchase order, capacity payment, or compliance obligation attaches to it, which makes it a live test of whether a target alone moves anything. The statute requires the CEC to revisit the number in each biennial energy report, and the 2025 report, published in June 2026, is its first formal check-in.
The last marker has already reported once. On July 29, 2025, home batteries enrolled in the state's DSGS program and the ELRP were dispatched together between 7 and 9 PM, delivering about 535 MW of average output, measured from Sunrun and Tesla telemetry (secondary reporting put the fleet at more than 100,000 batteries across the three big utilities, with more than a third of the output from SCE customers by Edison's account). That is small against the 15 GW grid battery fleet, but it demonstrates that aggregated home batteries deliver on dispatch. Whether California procures that resource the way it procured storage is the question this case leaves open.
Dockets to Watch
The proceedings that will decide whether the demand side gets procured, current as of July 2026.
| Proceeding | What it decides | Status and next milestone |
|---|---|---|
| CPUC R.25-09-004 (demand-response rulemaking) | Post-2027 DR funding for the large utilities, including ELRP's fate; staff proposes a two-year bridge of the 2027 portfolios | Proposed decision on 2028-2029 bridge funding expected in the second half of 2026; 2030-2034 program applications proposed for January 2028 |
| CPUC R.25-10-003 (resource-adequacy reform) | Unforced-capacity (UCAP) accreditation for the 2028 RA year and new qualifying-capacity counting for storage and demand response | Track 1 decision on the CPUC's July 2, 2026 voting agenda |
| CPUC A.24-12-008 (SCE demand-flexibility rates; the R.22-07-005 rulemaking closed in August 2025) | SCE's full-scale hourly marginal-cost rates under the Load Management Standards | Supplemental testimony ordered by D.25-08-049; hourly rates due to each customer class by January 1, 2027 |
| CEC 23-LMS-01 (Load Management Standards) | Implementation of the hourly-rate requirement and the MIDAS rate database | Rates available by January 1, 2027, or an approved alternative load-flexibility program |
| CEC load-shift goal (docket 25-IEPR-05) | The statutory demand-side target, up to 7 GW of load shift by 2030 | First biennial adjustment due in the 2025 IEPR, published June 2026 |
| SB 913 (Becker) | A CPUC methodology to credit aggregated-DER exports in resource adequacy, letting VPPs compete as capacity | Passed the Senate; in Assembly Appropriations as of June 2026 |
| 2025 VPP bills (AB 44, AB 740, SB 541) | Would have expanded VPP and load-management mandates | Vetoed October 2025; the SB 541 veto was sustained in March 2026 |
Programs and Rates Tracker
A snapshot of the SCE and California flexibility programs and rate changes this case turns on, meant to be updated as filings move.
| Program (customer-facing) | Official designation | What it does | Latest status |
|---|---|---|---|
| Base Interruptible Program | BIP | Large C&I firm curtailment | ~396 MW average event (2024), the largest average event impact in SCE's PY2024 DR portfolio |
| Summer Discount Plan | SDP | AC cycling on hot days, utility controls the switch | ~151k residential, ~88 MW average event (2024) |
| Smart Energy Program | SEP | Smart-thermostat DR via ecobee, Nest, Honeywell | ~79k enrolled, ~56 MW average event (2024) |
| Capacity Bidding Program | CBP-E | Aggregator-bid load reductions | ~11 MW ex-ante summer capacity in the CPUC's 2026 allocation |
| VPP aggregator path | ELRP subgroup A.4 | Aggregated home batteries, paid $2/kWh during events | 2,491 sites, dispatched 7 times for 7.3 MW in 2025 |
| EV aggregator path | ELRP subgroup A.5 | Vehicle-grid-integration aggregators (Ford via Olivine), paid $2/kWh | ~70 sites in 2025; forward estimate below 0.5 MW for 2026-2027 |
| Power Saver Rewards | ELRP subgroup A.6 | Residential behavioral DR, paid $1/kWh during events | ~1.6M enrolled (2025; ~1.7M in 2024), not called in either year; sunset at the end of 2025 |
| Charge Smart SoCal | - | Managed EV charging via WeaveGrid, Gateway Cities pilot | Launched July 2025, target 3,000 drivers; not part of the evaluated DR portfolio |
| Demand Side Grid Support | DSGS | State-funded capacity, about $108/kW-year for a 4-hour battery | Funding pulled back in 2025 (not cancelled, about $64M remaining as of October 2025) |
| Base Services Charge | Income-graduated fixed charge (AB 205) | About $24/month fixed charge | Rolled in November 2025 |
| Hourly rate | CEC Load Management Standards (23-LMS-01) | Optional wholesale-linked hourly rate | Required by 2027 |
Methods and Sources
This case rests on three reconstructions, each built from primary sources and tied to an independent anchor.
The bill. We rebuild a representative SCE residential bill from the tariff sheets, merging each filing forward on a fixed class-average usage shape, so the comparison isolates rate design from behavior. Every month decomposes to the penny into its functional categories, and the total ties to SCE's own typical-bill notices (500 kWh, Region 9, which name no schedule but track the flat Domestic rate we infer) within about 4% on the flat basis. EIA-861 bundled average revenue per kWh is a directional cross-check only, not a level anchor, because it is inflated by the departure of roughly 40% of bundled sales to CCAs over the same window, which spreads fixed costs over fewer bundled kWh. The basis is hybrid, flat Schedule D before 2022 and the default TOU-D-4-9PM after, which tracks the opt-in-to-opt-out change in the default rate.
The dispatch. The CAISO supply and evening-dispatch figures come from CAISO's own five-minute fuel mix back to 2019, not the EIA-930 proxy, with the battery and gas numbers taken as the median of daily values. The demand-response figures are the SCE PY2024 and PY2025 Load Impact Evaluations.
The price. The SP15 real-time and day-ahead prices and the SoCal Citygate gas price come from CAISO. The evening-premium attribution is observational, so it is reported as evidence, not a clean causal estimate. An internal permutation-significance model finds the deepening midday solar surplus and the net-load pressure shape are the dominant price-shapers from 2024 to 2025, with batteries monetizing that shape by charging midday and discharging into the evening. The published claim stays with the robust natural experiment, the premium compressing despite higher gas, not a single-cause attribution.
Every published figure traces to a cached primary source or is labeled as our own derived estimate, and the code and the full source manifest are open.
A note on vintage. California publishes current resource-adequacy planning and capability data, but the most recent published measure of demand response actually counted toward resource adequacy is the CAISO market monitor's 2024 report, and no public source isolates the residential-battery share. We use the 2024 figure as the latest available and treat the residential share as a documented gap.