Figure
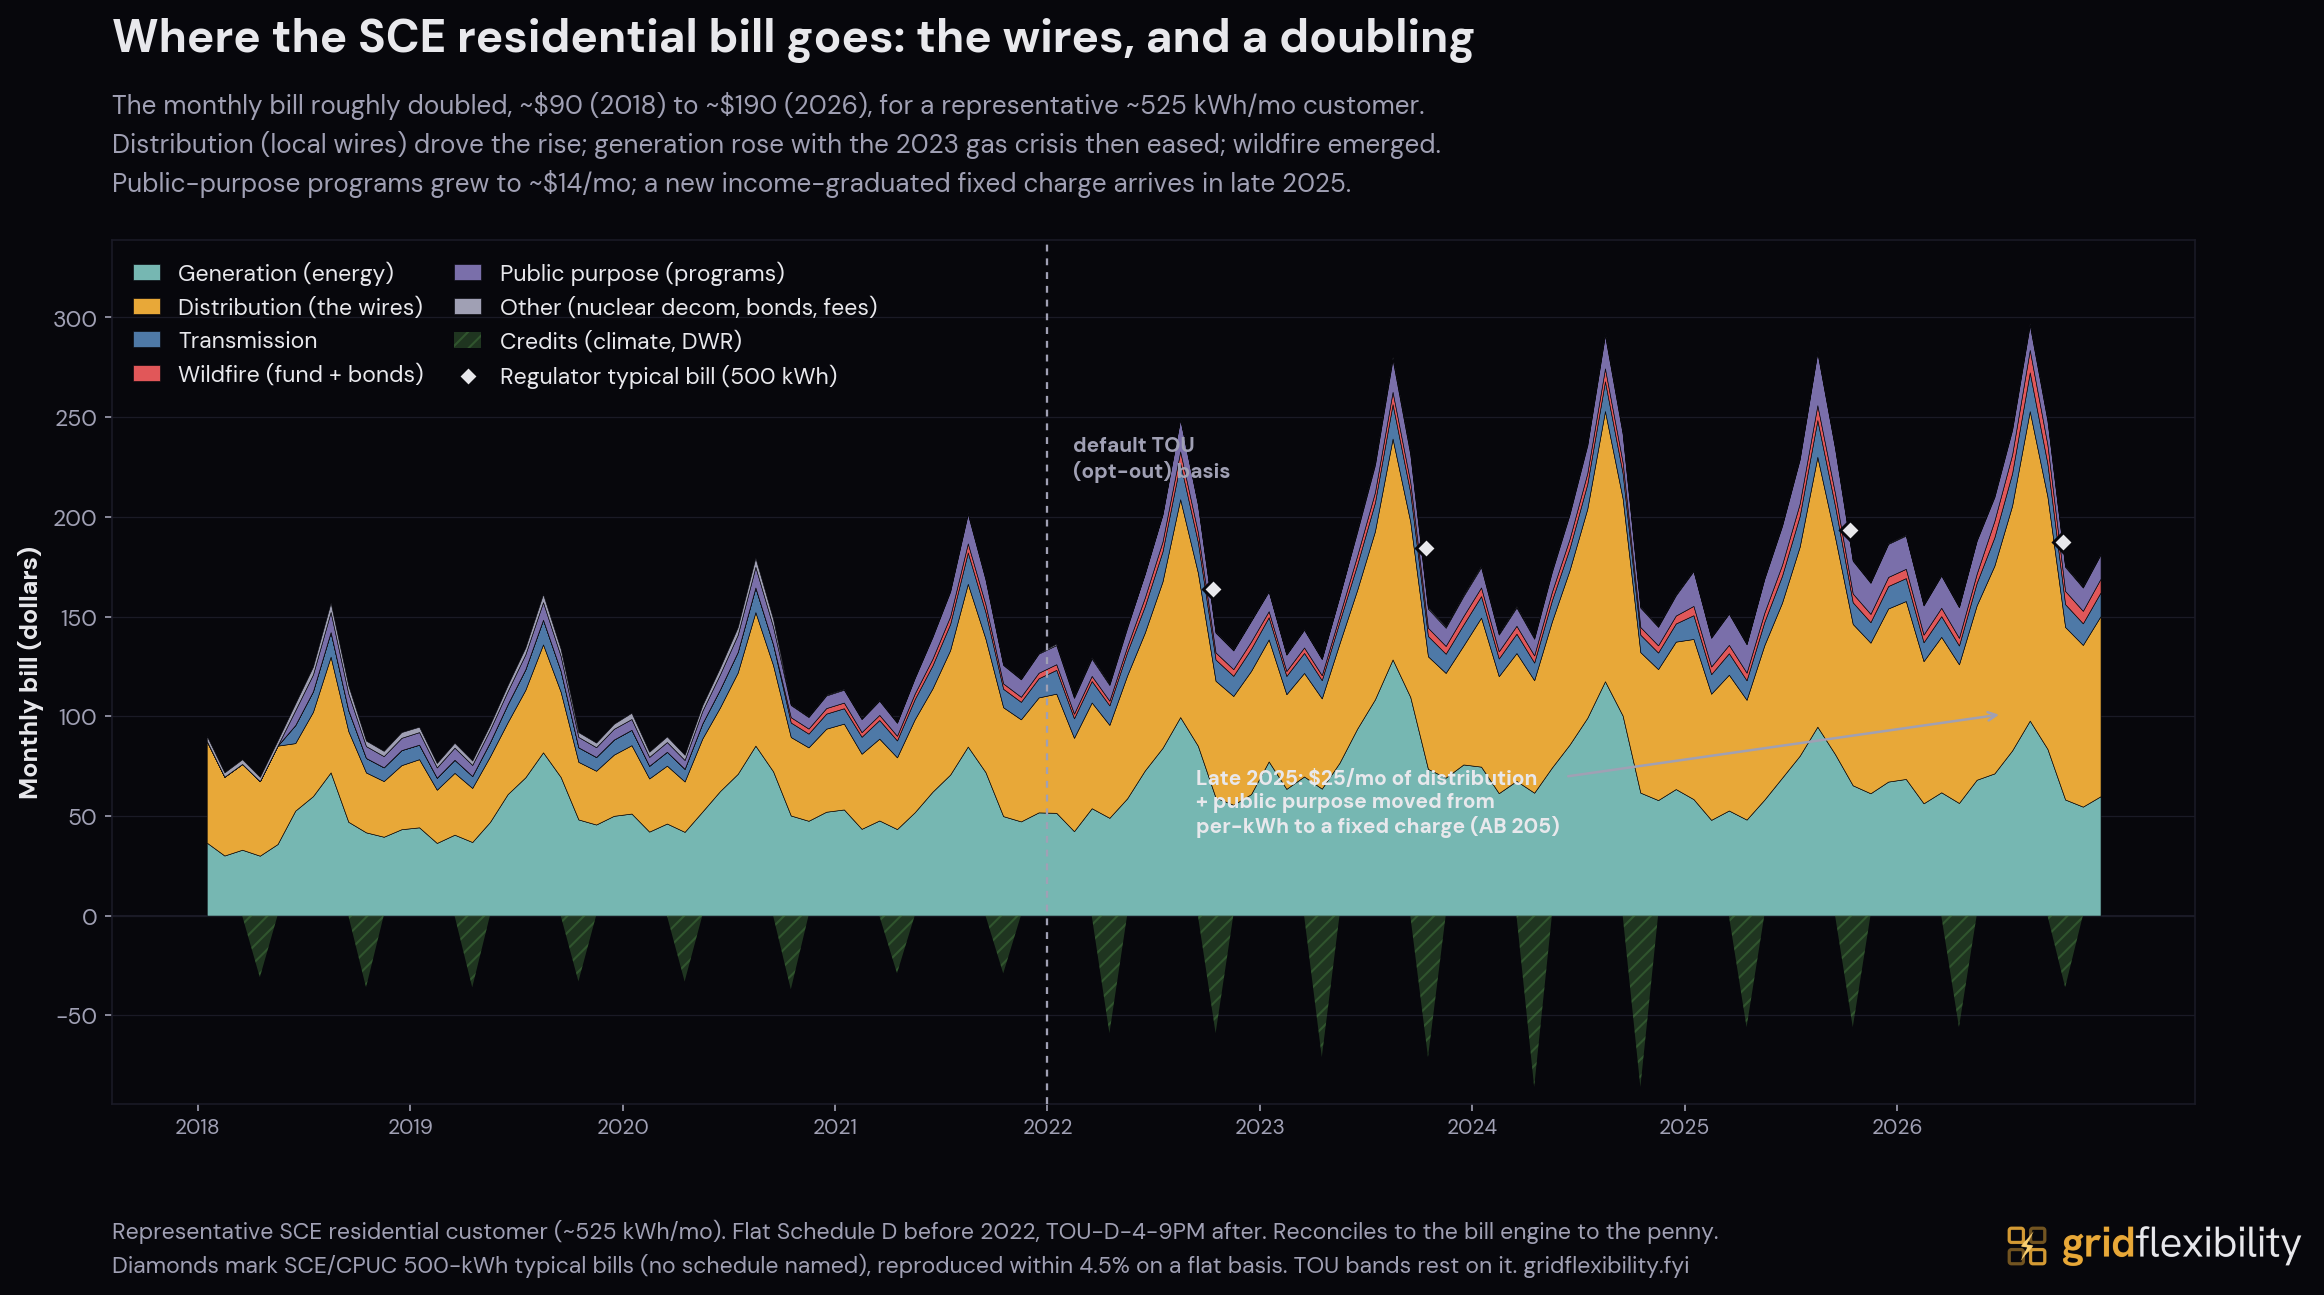
The same SCE residential bill decomposition on a monthly basis, which shows the seasonal swing (summer evenings are the costliest) that the annual view smooths out. Generation stays roughly flat; the growth is in delivery, the local wires.
This figure is from the Southern California Edison case study, a primary-source look at how California procured storage and what pointing the same playbook at demand would add.
Cite this figure
Corey Balgeman, "SCE residential bill by cost category, monthly, 2018-2026," Grid Flexibility, 2026. https://gridflexibility.fyi/case-studies/southern-california-edison/figures/bill-category-decomposition-monthly
New analyses are announced by email.
Last updated: 2026-07-03.