Figure
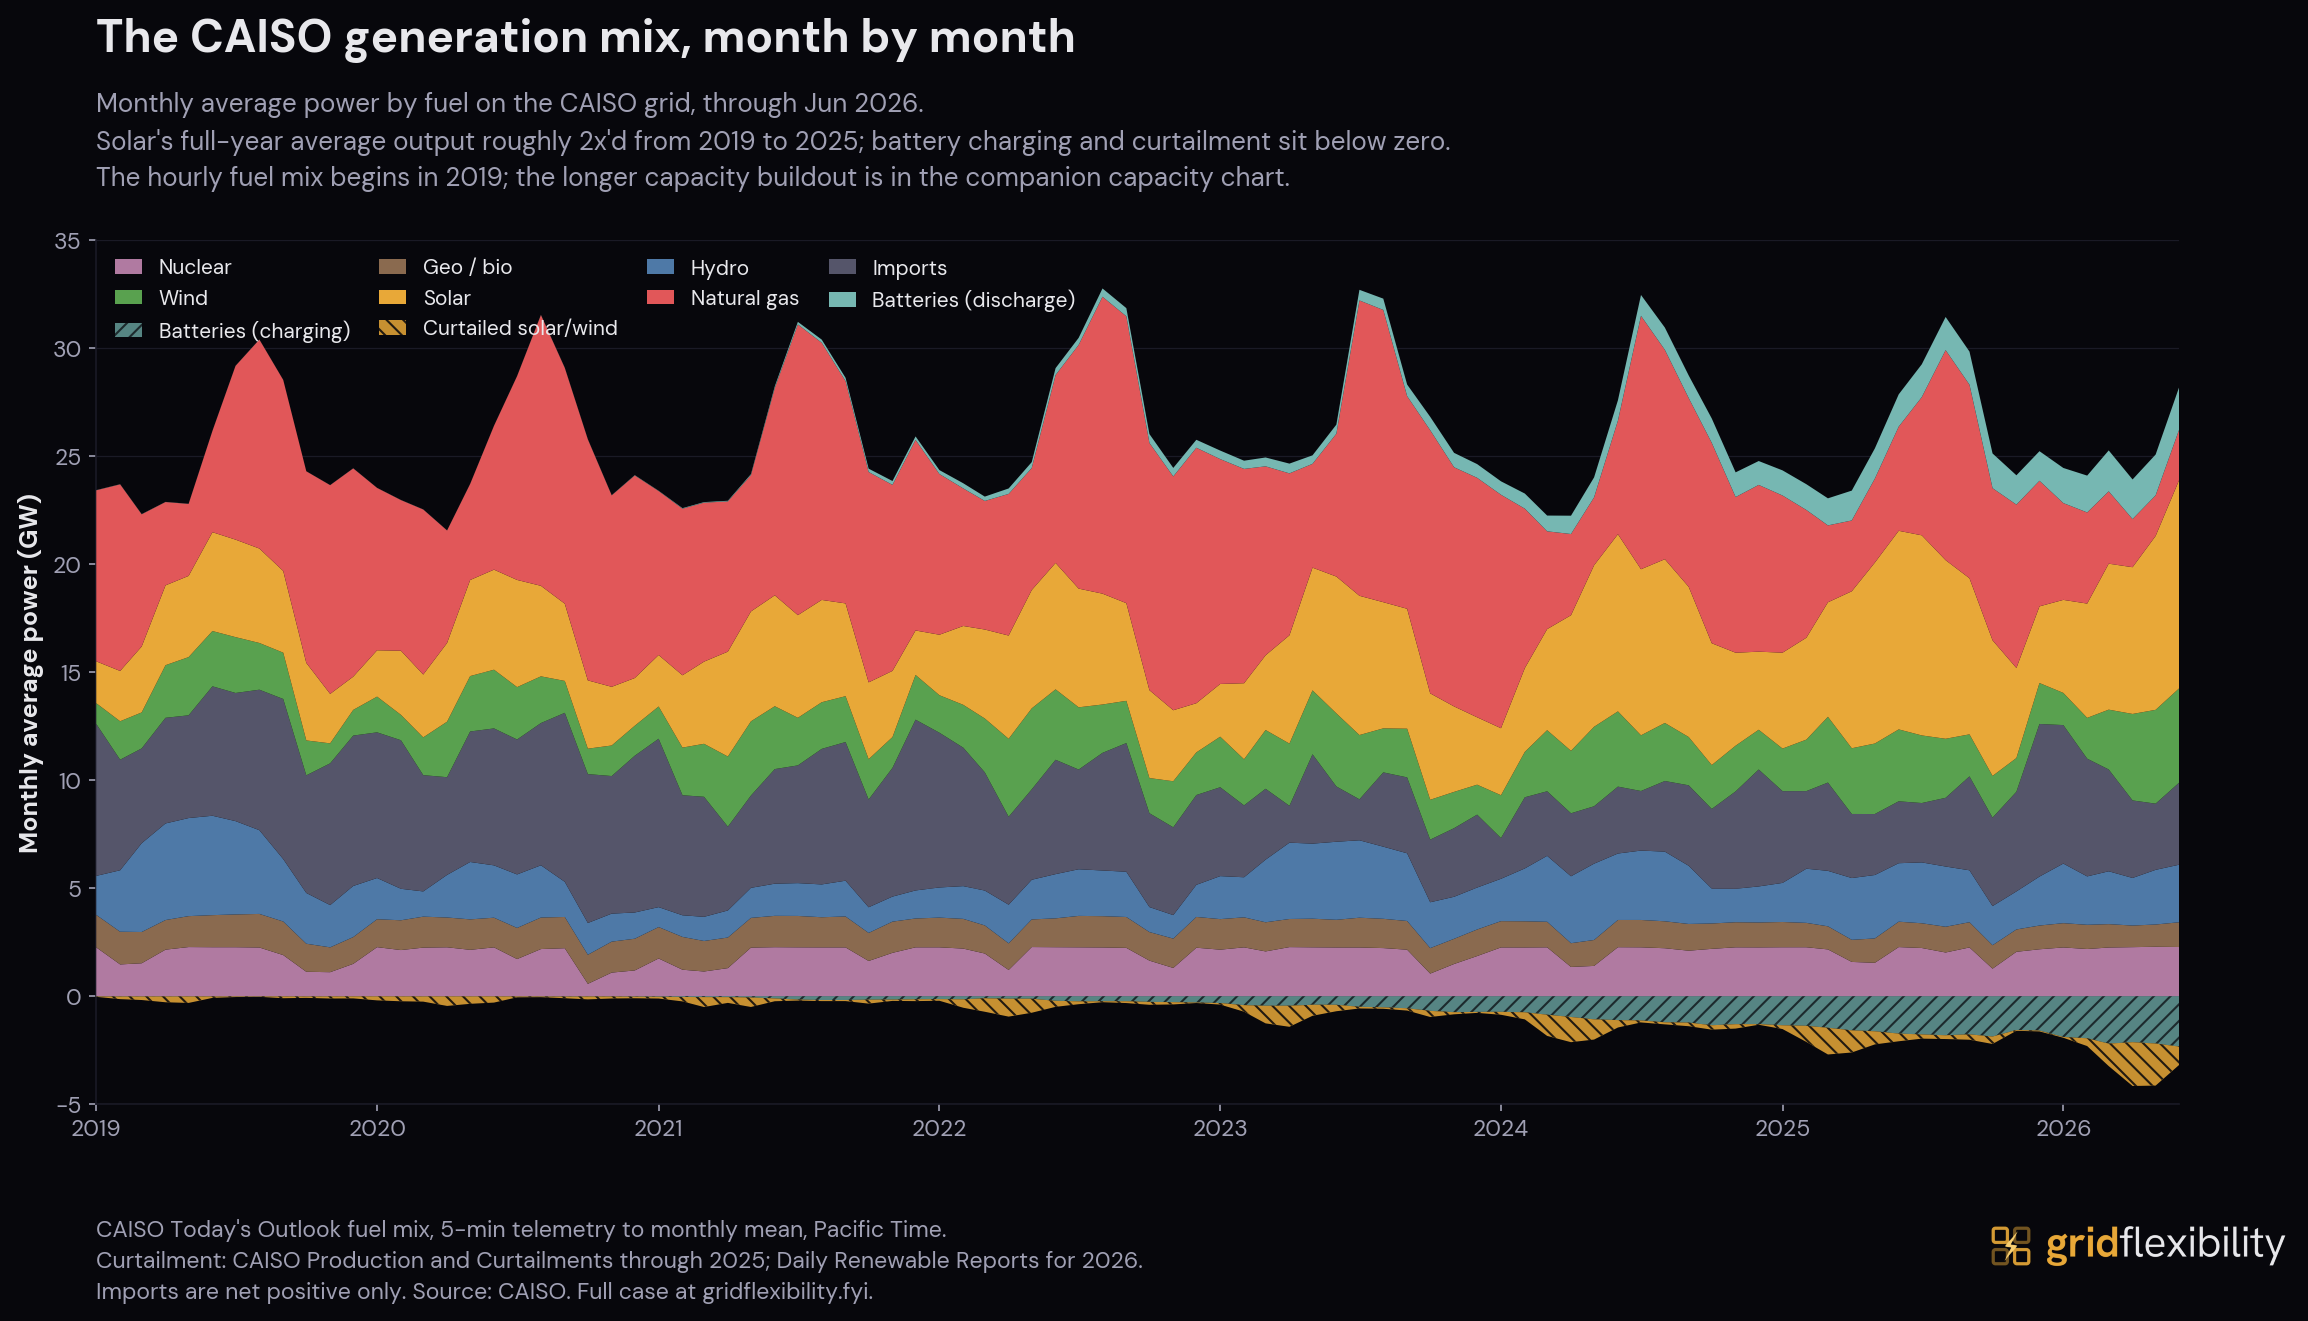
Month by month, battery discharge appears on top of the stack after 2021, and the bands below zero (charging and curtailed solar) deepen every spring.
This figure is from the Southern California Edison case study, a primary-source look at how California procured storage and what pointing the same playbook at demand would add.
Cite this figure
Corey Balgeman, "CAISO monthly fuel mix with battery charge and discharge, 2019-2025," Grid Flexibility, 2026. https://gridflexibility.fyi/case-studies/southern-california-edison/figures/fuelmix-monthly-trend
New analyses are announced by email.
Last updated: 2026-07-03.