Figure
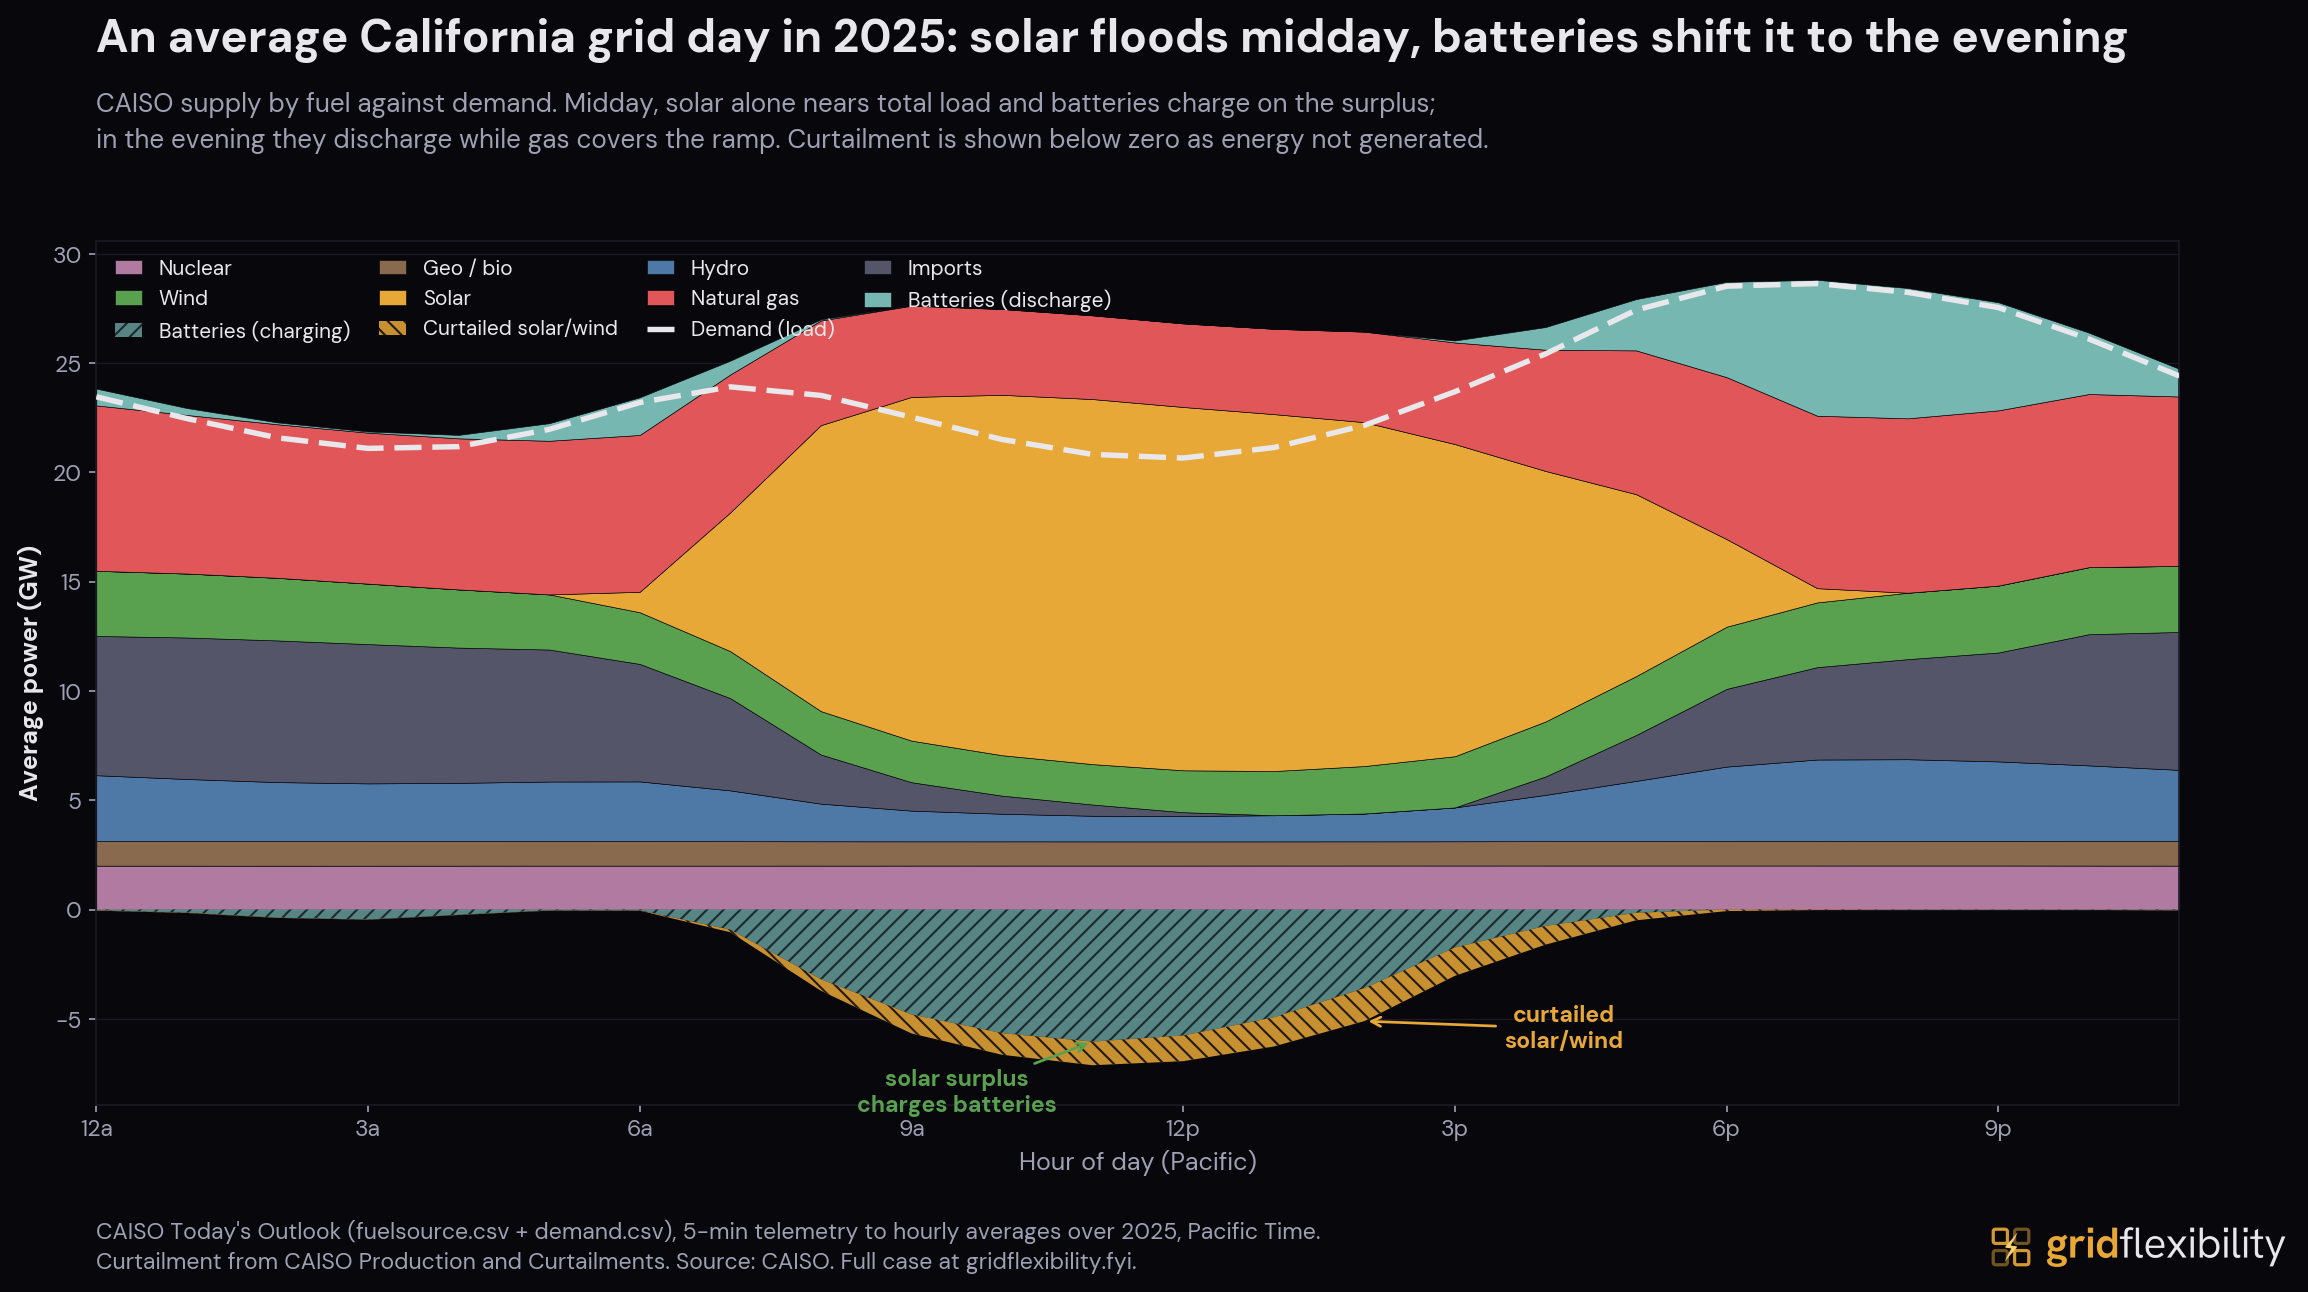
On an average 2025 day, solar alone nears total load around midday and the grid runs a surplus that batteries charge against and curtailment absorbs, then batteries discharge into the evening as gas, imports, and hydro cover the rest of the ramp.
This figure is from the Southern California Edison case study, a primary-source look at how California procured storage and what pointing the same playbook at demand would add.
Cite this figure
Corey Balgeman, "Supply by fuel against load on an average CAISO day, 2025," Grid Flexibility, 2026. https://gridflexibility.fyi/case-studies/southern-california-edison/figures/fuelmix-vs-load-2025
New analyses are announced by email.
Last updated: 2026-07-03.