Figure
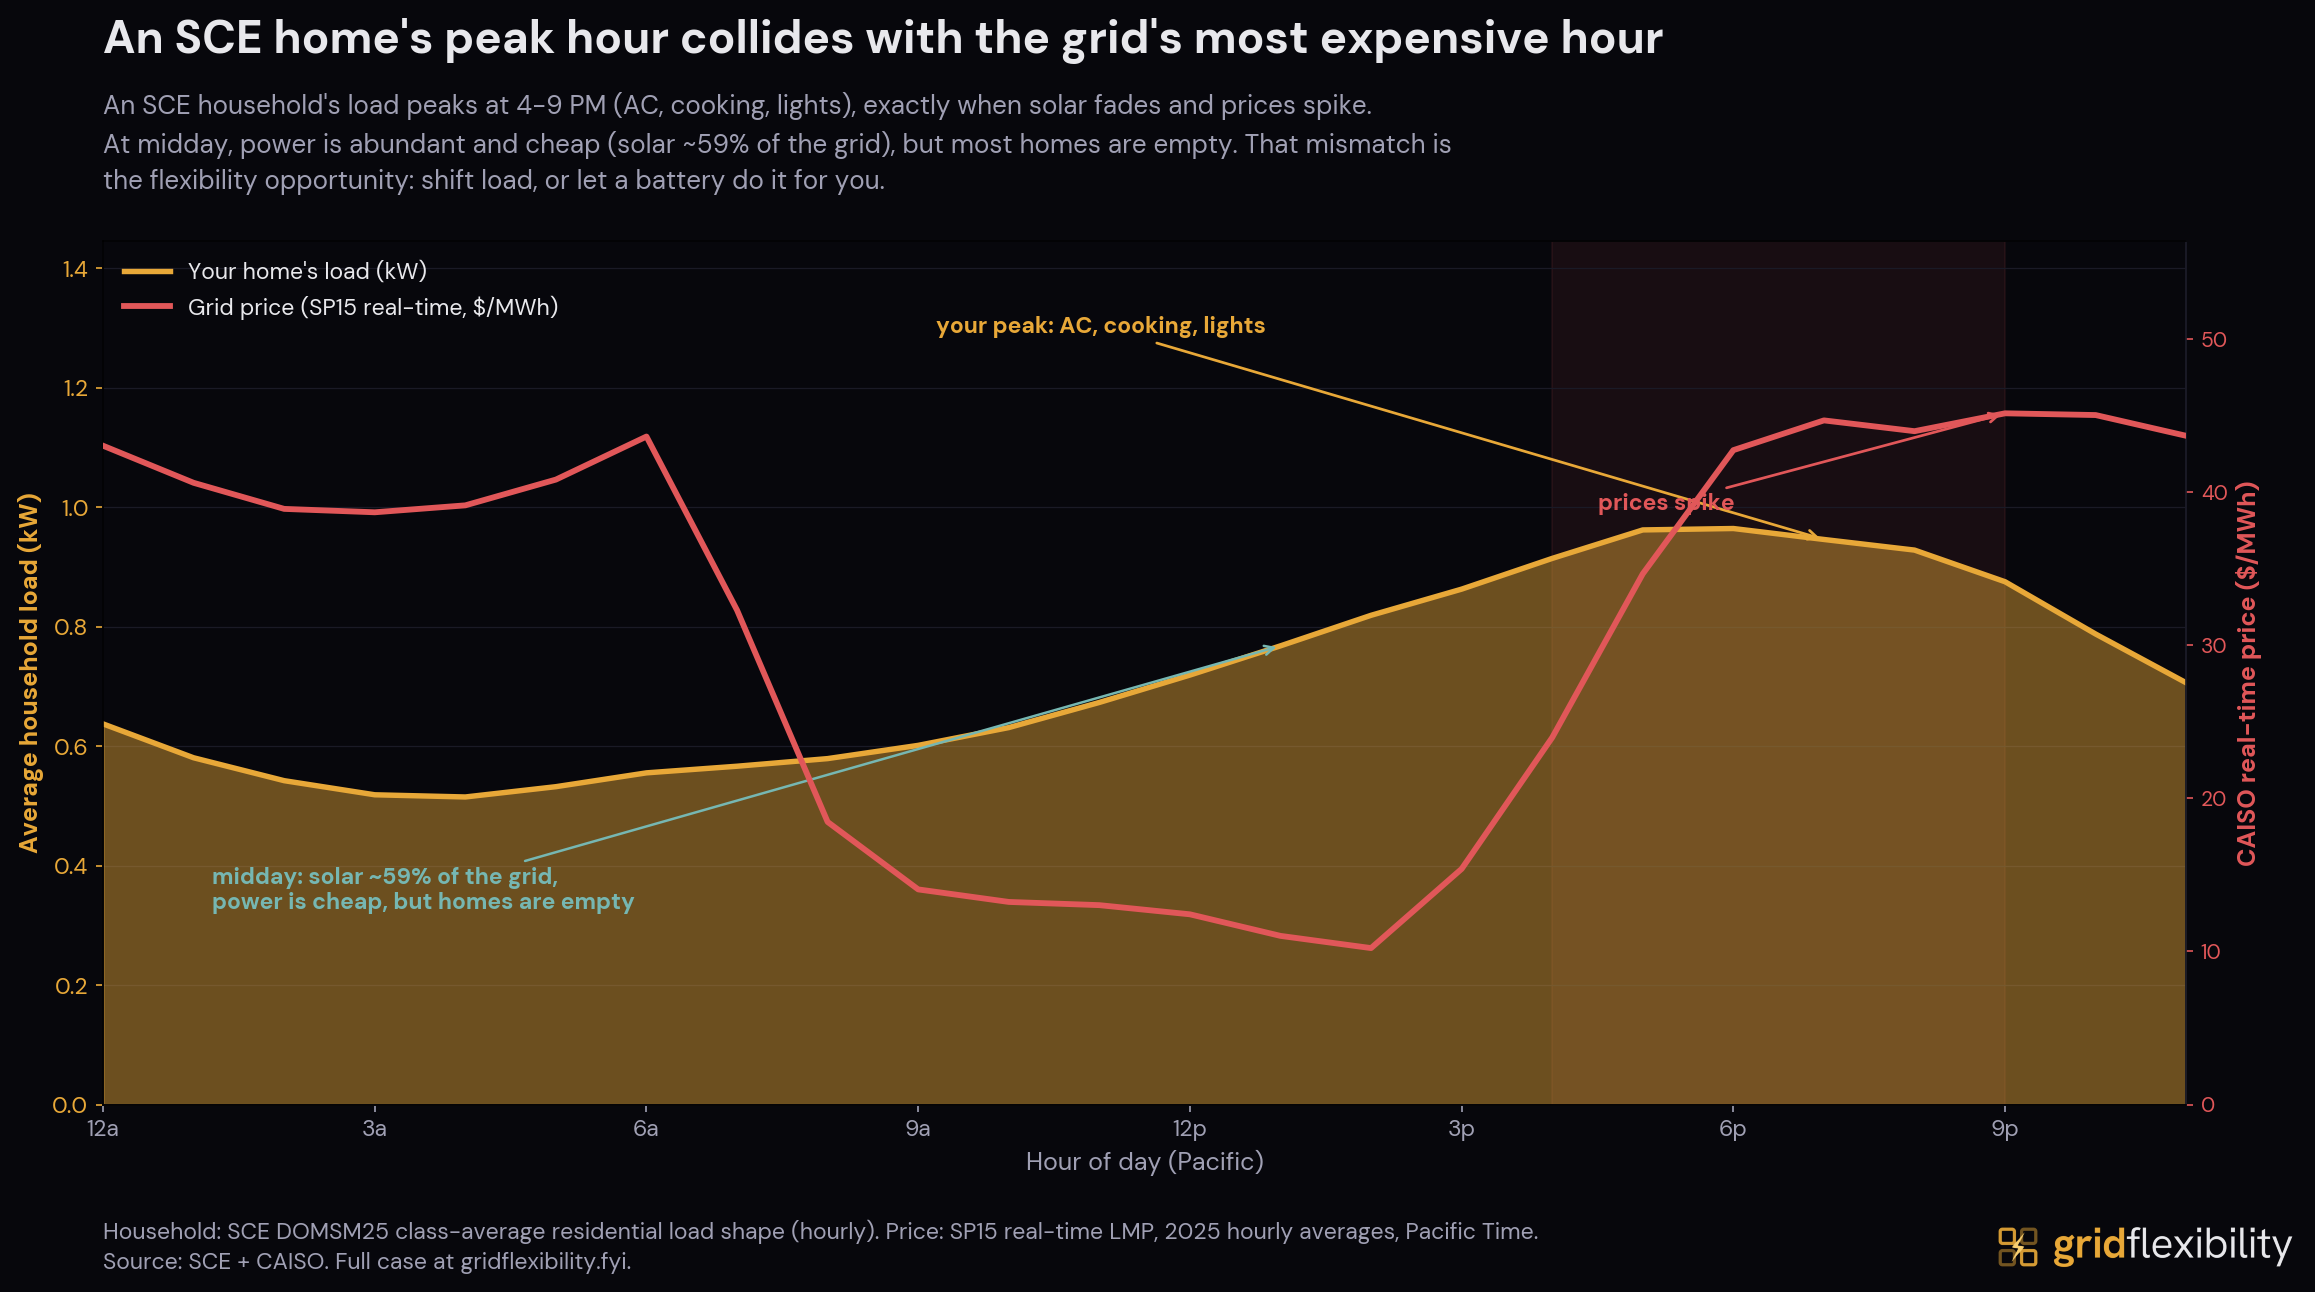
SCE's residential class-average load peaks between 6 and 8 PM, and the real-time wholesale price follows the same shape, so the household and the system strain in the same evening hours.
This figure is from the Southern California Edison case study, a primary-source look at how California procured storage and what pointing the same playbook at demand would add.
Cite this figure
Corey Balgeman, "An SCE household's heaviest hours and the grid's most expensive hours," Grid Flexibility, 2026. https://gridflexibility.fyi/case-studies/southern-california-edison/figures/household-vs-grid-day
New analyses are announced by email.
Last updated: 2026-07-03.