Figure
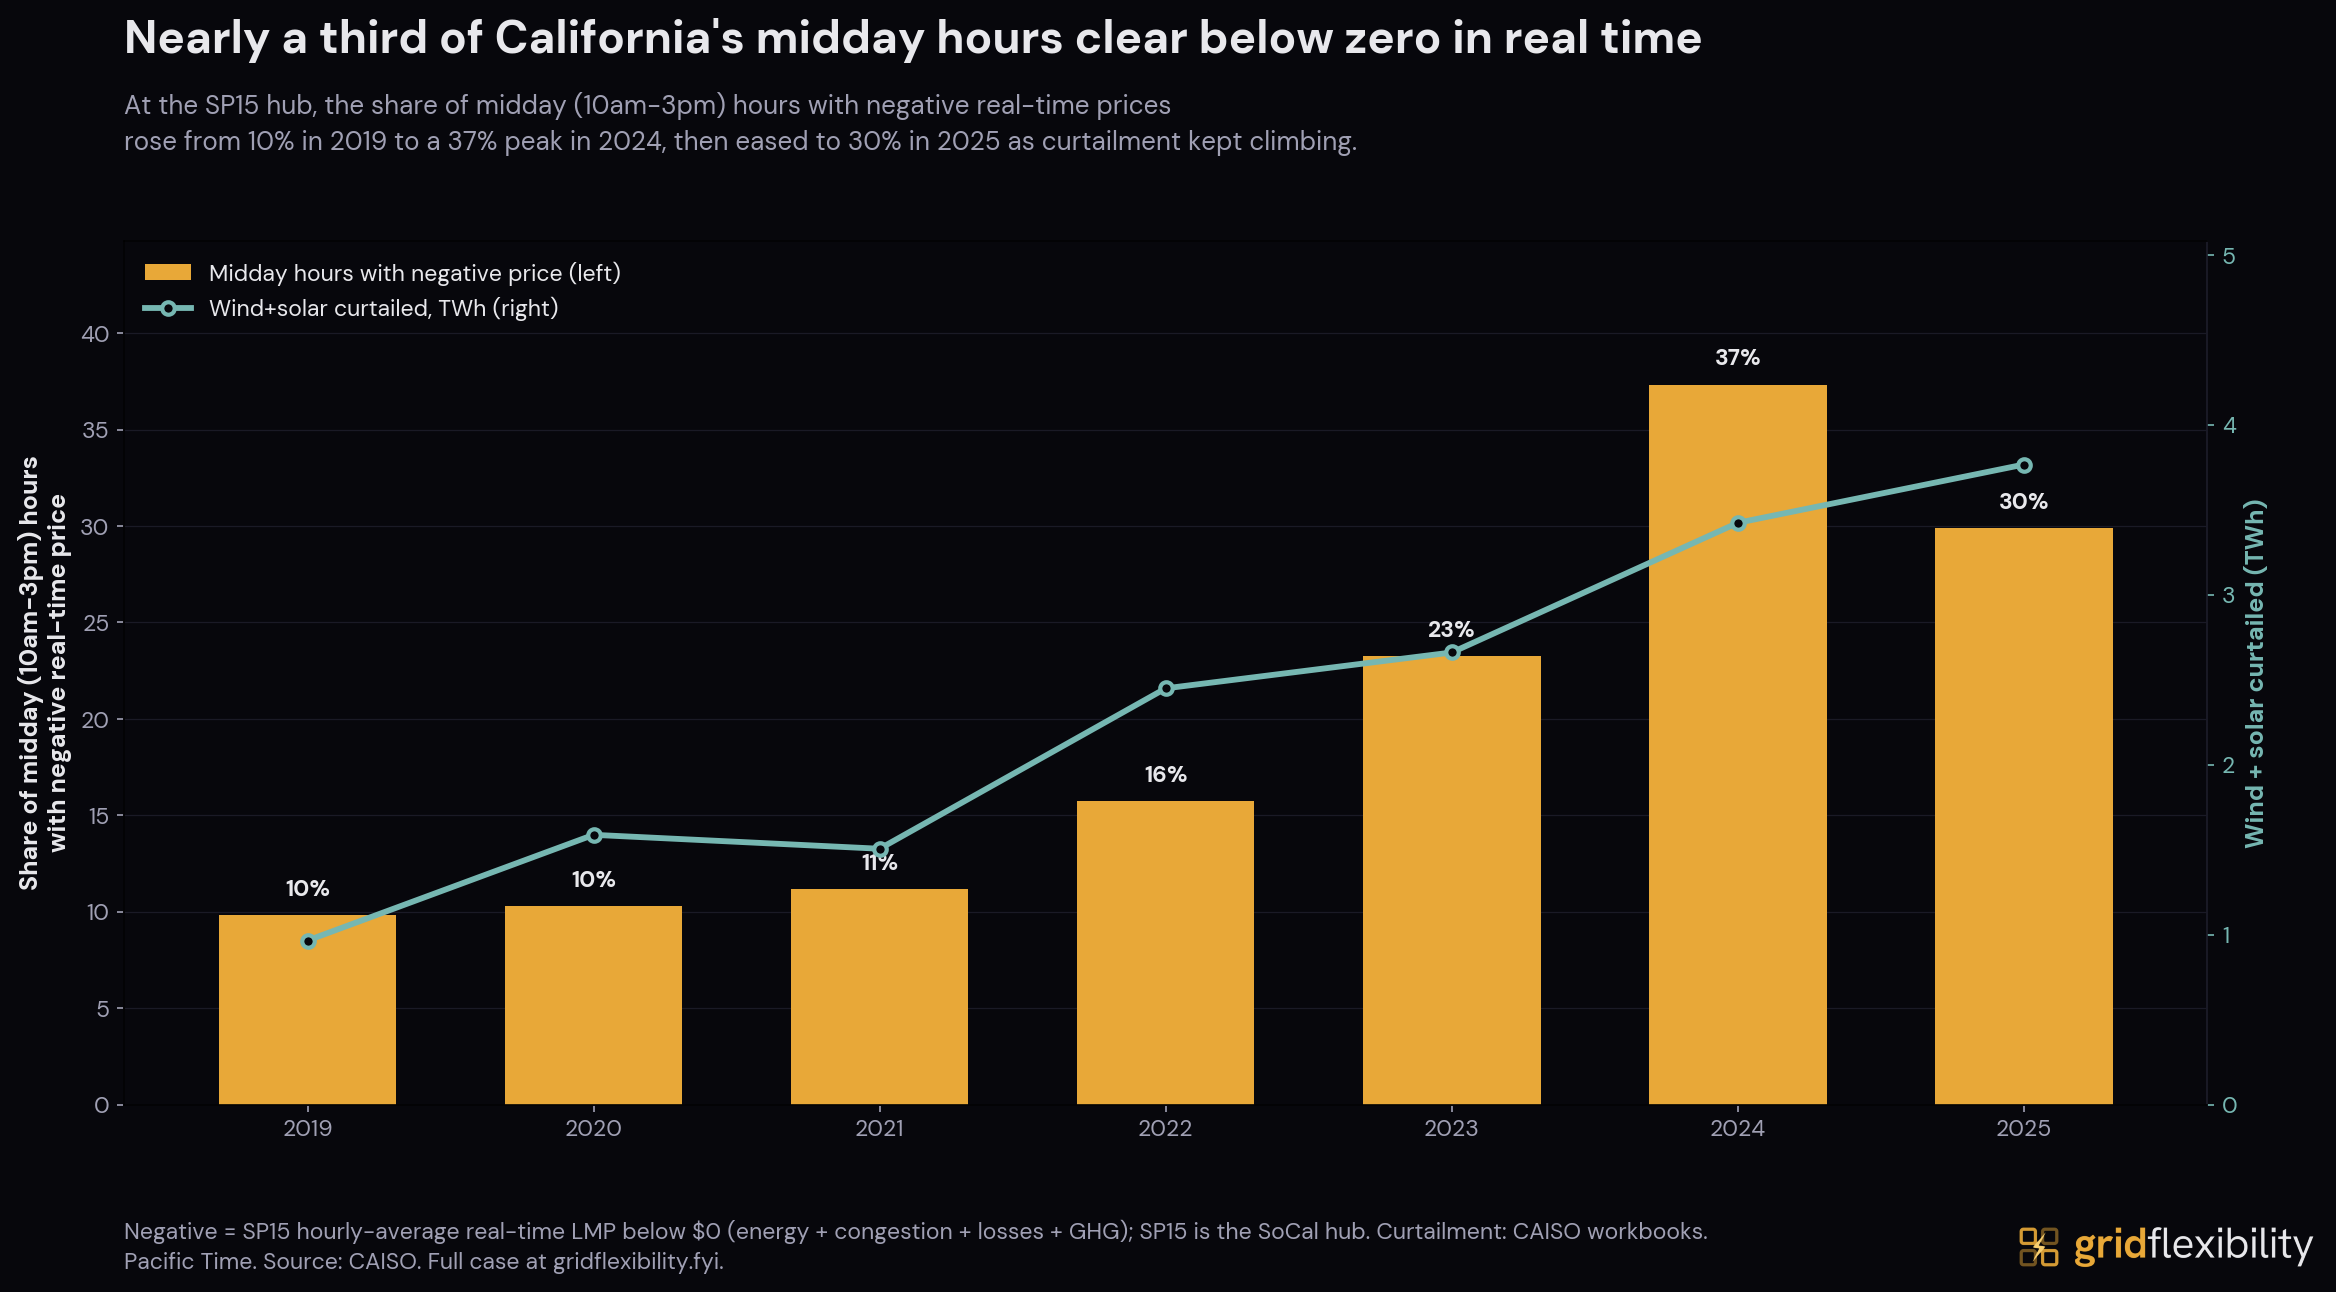
The share of midday hours with negative real-time prices rose from about 10% in 2019 to 37% in 2024, then eased to 30% in 2025 as more midday charging lifted prices off the floor.
This figure is from the Southern California Edison case study, a primary-source look at how California procured storage and what pointing the same playbook at demand would add.
Cite this figure
Corey Balgeman, "Share of midday hours with negative real-time prices, 2019-2025," Grid Flexibility, 2026. https://gridflexibility.fyi/case-studies/southern-california-edison/figures/negative-midday-surplus
New analyses are announced by email.
Last updated: 2026-07-03.