Case Study · ERCOT
ERCOT's telemetry crossed an all-time demand record on a week without record heat
On July 22, 2026, ERCOT's telemetry read 91,089 MW, past a record that had stood for three years. All five reference stations stayed at least three degrees below their own July heat records that week. ERCOT issued no emergency alert and no grid notice of any kind. What follows is what the public record shows about how a grid crosses an all-time peak quietly, and what it still cannot show.
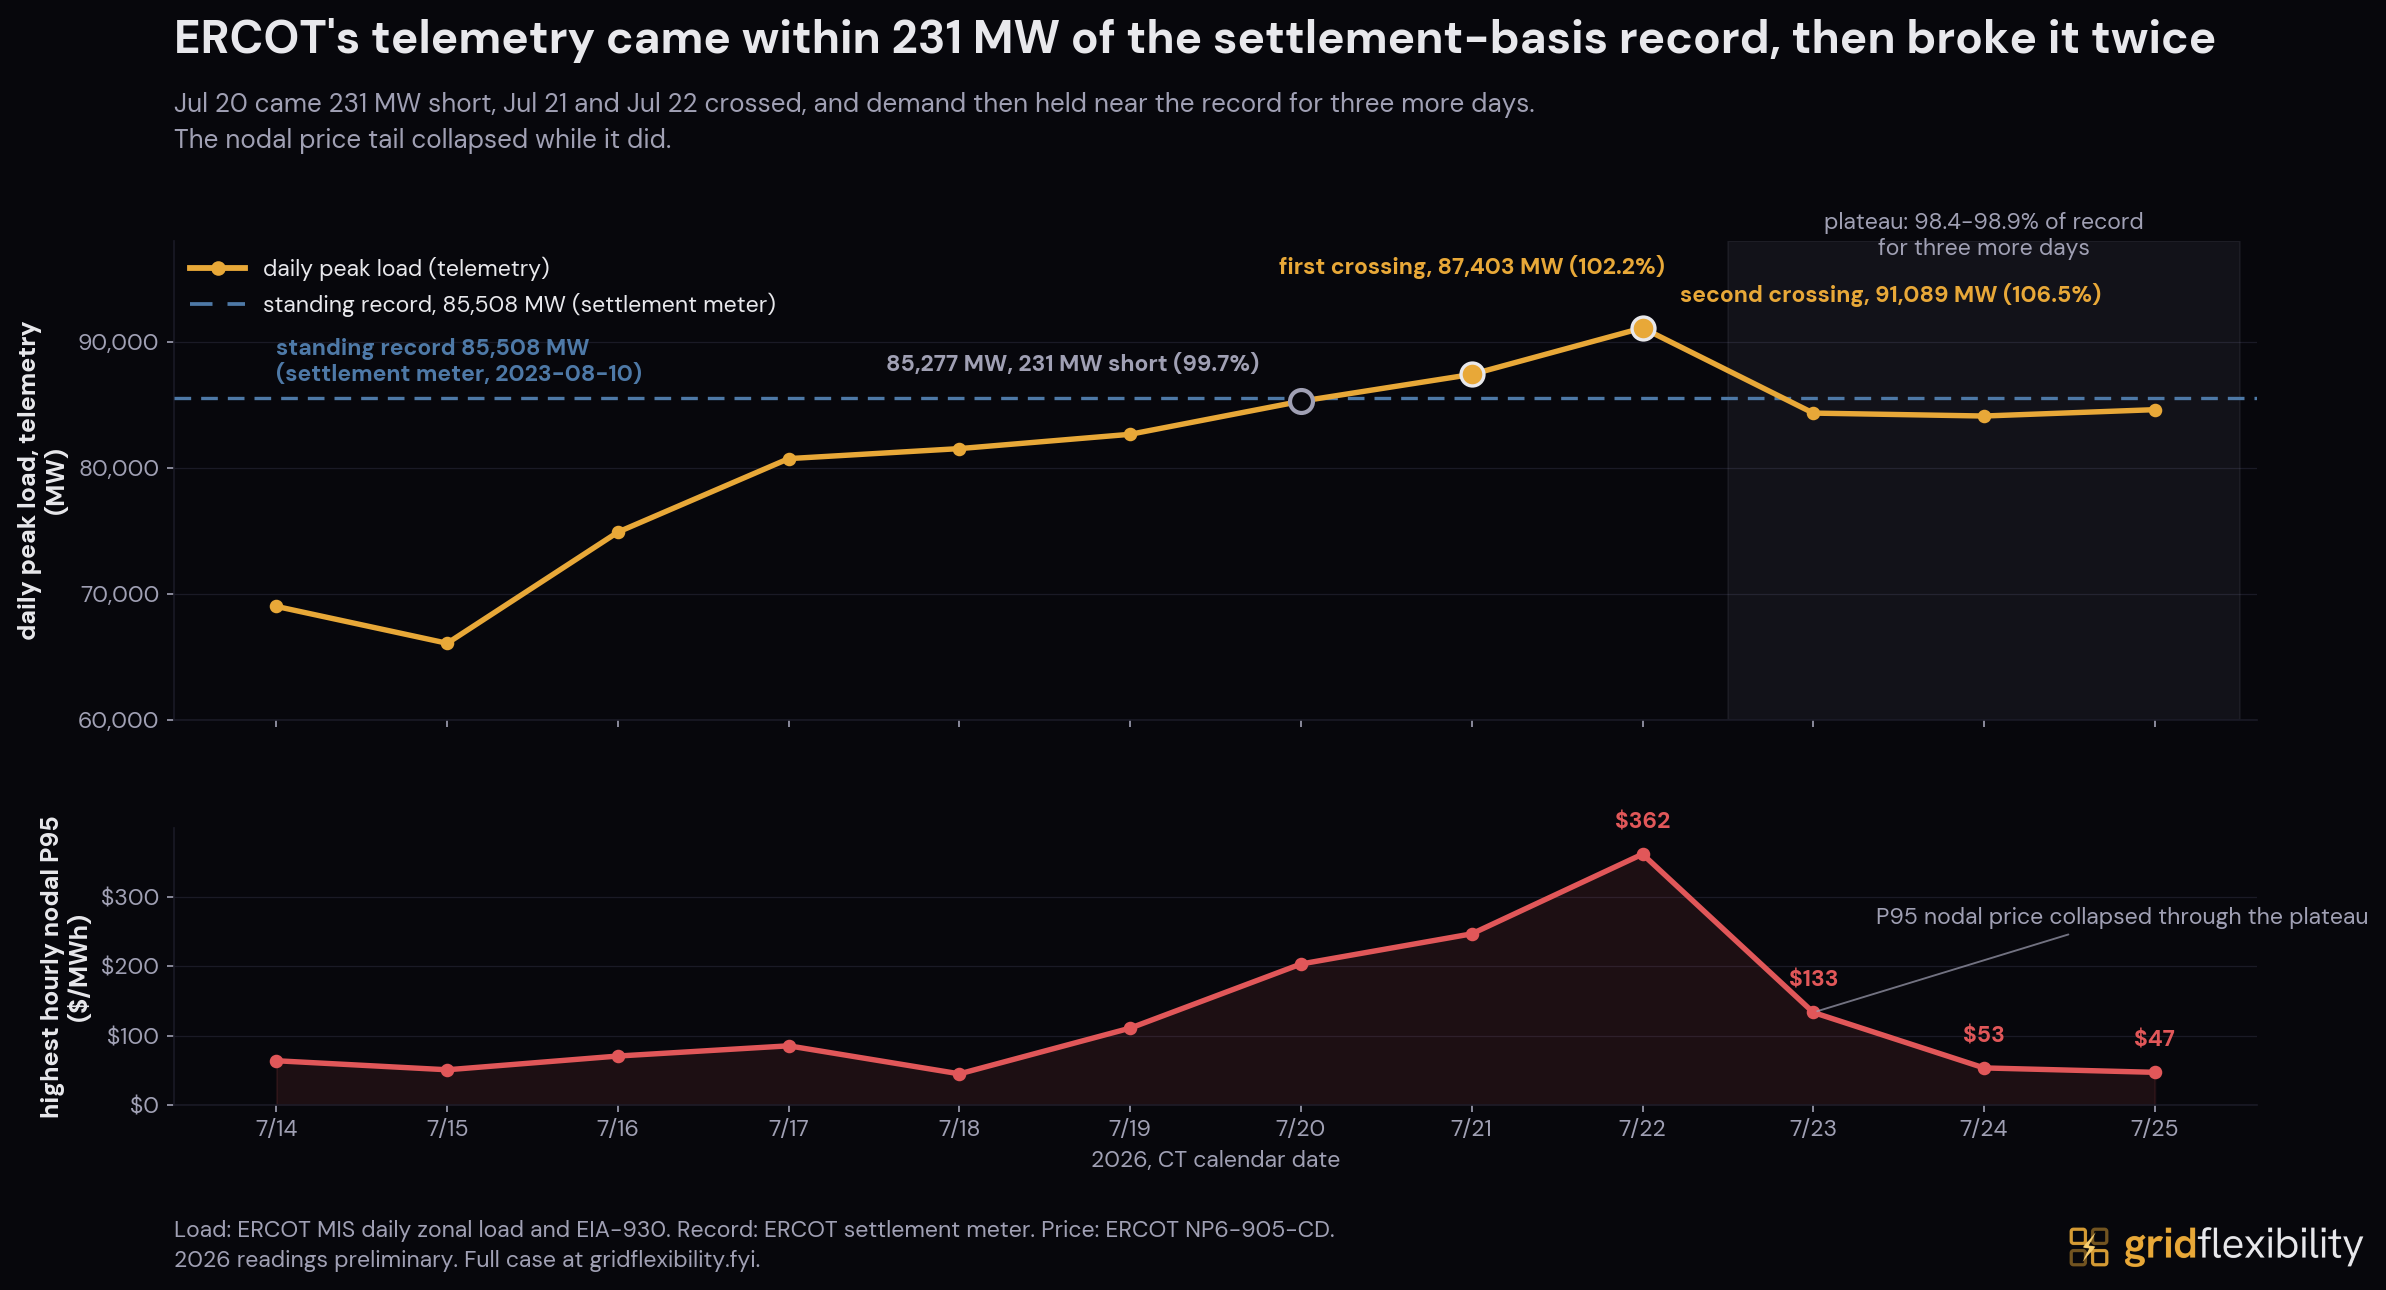
Key takeaways
- ERCOT's telemetry crossed its 85,508 MW standing record on two straight days: 87,403 MW on July 21 and 91,089 MW on July 22, 2026, after coming within 231 MW of it on July 20.# Demand then held within 1.6% of the record for three more days.
- It was not a heat record. ERCOT's four largest metro areas (Dallas-Fort Worth, Houston, San Antonio, Austin) and Midland, the Permian's load centre, all stayed 3 to 9 degrees Fahrenheit below their own July records that week, and 7 to 13 below their all-time highs. San Antonio's first 100-degree reading of 2026 landed on the peak day itself.
- Real-time hub prices averaged $34.49/MWh across the eight days around the 2026 record, against $198.41 across the same eight days around ERCOT's previous record in August 2023.# The median hub observation was nearly identical in both weeks, $26.73 and $27.31, while the 95th percentile differed by about sixteen times, $78.09 against $1,238.09.
- ERCOT served roughly 16.3 GW more at its 2026 peak than at its entire 2019 annual peak of 74,820 MW, a compound growth rate of 2.85% a year against about 1.4% a year across the 2010s. ERCOT's own weather-zone data puts the coincident increase at about 20,235 MW, led by DFW (27%) and Houston (22%), with Far West and the North zone growing fastest in percentage terms (75% and 77%).
- No Energy Emergency Alert, no Emergency Response Service deployment, and no formal grid notice of any type in ERCOT's control-room Operations Messages log across the window.# Ten of ERCOT's 14 all-time peak records since 2000 came with an emergency alert or a formal notice the same day. Of the four that did not, one predates the notice system, one had a week-long heat notice already running, and one is a disputed record ERCOT never announced. July 22, 2026 is the only clean zero.
- ERCOT's battery fleet set what was then its all-time record the same evening: 12,017 MW at 20:24 CT, 14.11% of the load being served at that reading. It stood until August 18 and was broken again on August 23.# The demand record had landed three and a half hours earlier, with solar supplying 30.1 GW of it while the storage fleet was net charging.
- Solar ran hot and supplied 30.1 GW in the demand-record hour. On the module ERCOT's own planning study assumes, a 105 degree Fahrenheit afternoon costs 16% to 19% of DC output against the 77 degree lab rating. Solar still reached 33.5 GW at its own midday peak on July 22, and 30.1 GW when the demand record landed.
Every 2026 figure here is preliminary telemetry, and the peak is ERCOT's integrated system load for the full hour rather than an instantaneous reading, which is the basis ERCOT states it uses for records; the 85,508 MW record and the 74,820 MW 2019 peak are settlement-meter readings confirmed months after the fact. Full accounting is in Methodology and basis.
The Event
A Record Without a Weather Event
ERCOT's telemetry read 91,089 MW on July 22, 2026, above the 85,508 MW record that had stood since August 10, 2023. The record was not a single spike. July 20 came within 231 MW at 85,277 MW, July 21 reached 87,403 MW, and demand then held within 1.6% of the record for three more days: six consecutive days between 1.6% below and 6.5% above it (hero chart), climbing to that plateau from 69,005 MW on July 14. Every 2026 reading stays preliminary until ERCOT's Demand and Energy Report confirms it.
The week was hot, and no reference station reached a record. ERCOT's four largest metro areas, Dallas Fort Worth, Houston, San Antonio, and Austin, plus Midland at the centre of Permian load growth, all stayed 3 to 9 degrees Fahrenheit below their own July records, and 7 to 13 below their all-time highs. Houston came closest, at exactly 3 degrees. San Antonio did not reach 100 degrees until the peak day itself, about three weeks later than its typical first hundred.
That combination is what makes the week worth reading. Crossing a standing demand record while every reference station sat well below its own heat record is consistent with a higher load baseline underneath. How much higher is a separate question.
Where the Load Came From
ERCOT served roughly 16.3 GW more at its 2026 peak than at its entire 2019 annual peak of 74,820 MW. The peak has grown 2.85% a year compounded since 2019, roughly double the 1.4% a year it averaged between the 2010 record of 65,776 MW and the 2019 record.
Three zones carry two thirds of it. ERCOT's own hourly weather-zone load data puts the coincident increase since 2019 at about 20,235 MW system-wide (Grid Flexibility analysis). It runs higher than the 16.3 GW above because it measures each summer's peak hour rather than each year's single highest hour. The DFW zone carries 27%, Houston 22%, and South Central 17%. Far West carries 15% on a base small enough that it amounts to a 75% increase, and the North zone, which takes in the Panhandle, grew 77%.
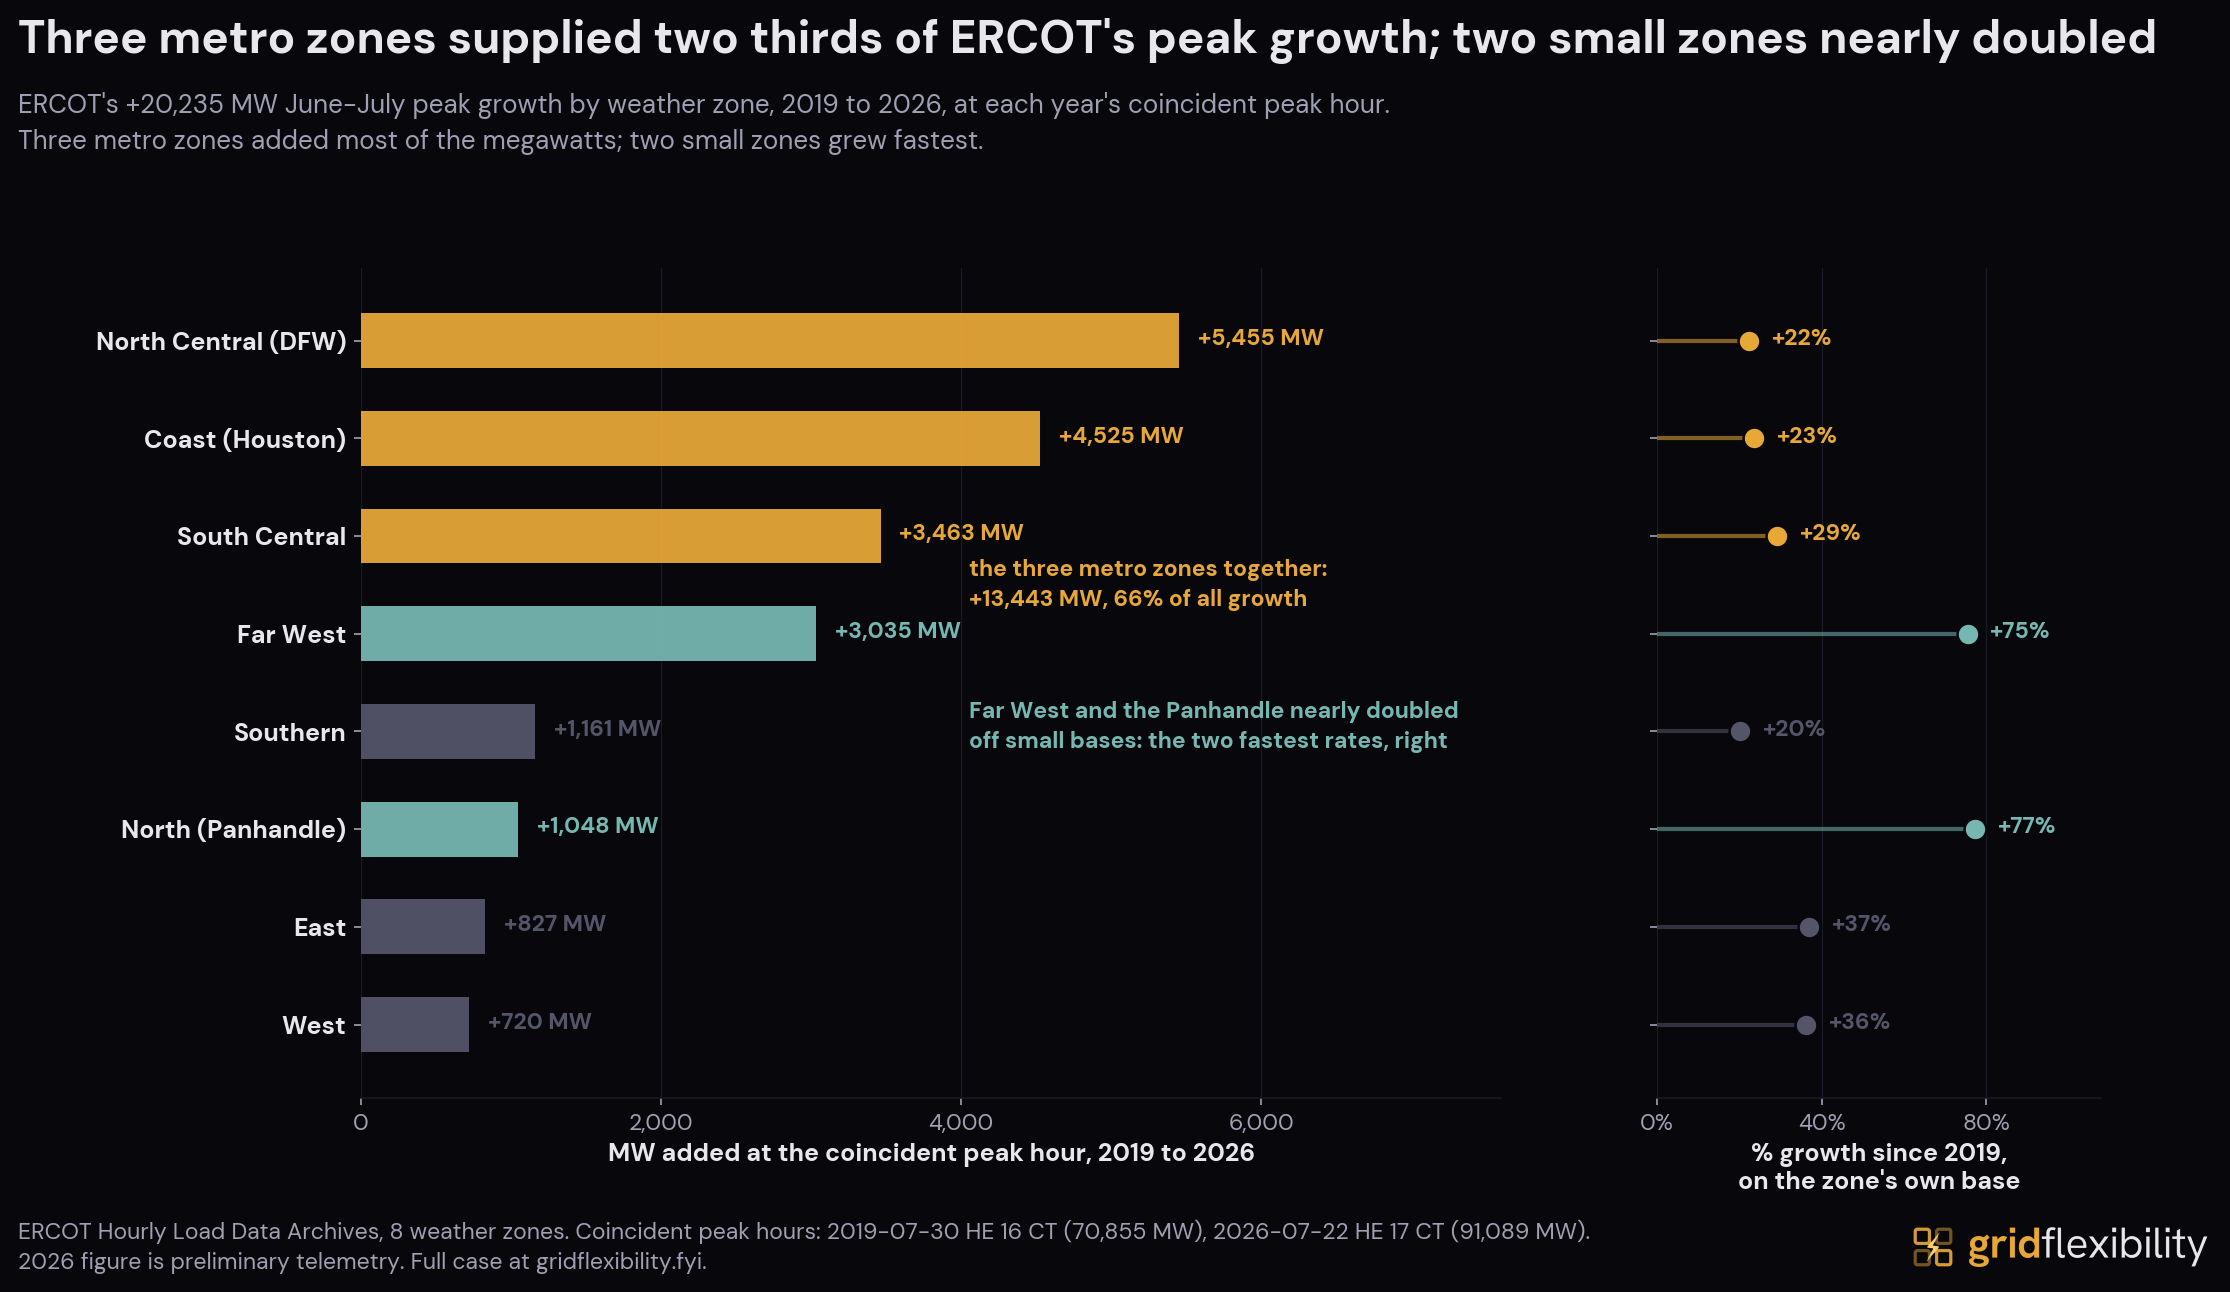
Far West is the Permian Basin, where ERCOT's own account of growth runs to oil-and-gas electrification, crypto mining, and data centers. The North zone's 77% is the steepest rate of any zone, off the smallest base: about 1.0 GW added on a 2019 base of 1.4 GW. Our data centers analysis itemizes ERCOT's forward large-load pipeline by load type.
Start with what ERCOT has already measured. Its January 2026 System Operations Update counts about 400 operational non-crypto data centers of 1 MW or larger, drawing 3.1 GW to 3.6 GW on an average day, up 15.5% in a year. The large loads it tracks through interconnection grew from 2.6 GW energized in 2022 to 5.9 GW in 2026.
Its forecast is a different measure entirely. ERCOT's 2025 long-term forecast puts ERCOT's net peak growth from 2026 to 2031 at 49.3 GW. Its own hourly forecast splits the large-load part by how firm the commitment is, and the split is the point: 4.3 GW of large flexible load, 13.3 GW under signed and financially committed contracts, and 30.0 GW resting on officer letters, which ERCOT defines as a request with no signed agreement. Two thirds of the growth it forecasts sits in the tier nobody has signed for. Each tier peaks in its own hour, so the three sum to 47.6 GW rather than to the 49.3 GW net figure.
A third number dwarfs both, and it is the one that ends up in headlines. ERCOT publishes three counts of its large-load pipeline. Its June request list holds about 474 GW through 2032 and 2033, roughly 90% of it data centers, and 88% of that submitted no studies or is still under ERCOT review. Its Batch Zero screen in July sorted a slightly larger pile, about 498 GW, and identified roughly 205 GW with a qualifying study and dynamic model behind it. Its energized series, which sums each site's own highest recorded draw rather than a simultaneous total, reads 5.9 GW.
Most of that pipeline is unstudied. In the request list, 284.3 GW submitted no studies and another 135.5 GW is still under ERCOT review. In the Batch Zero screen, 274 GW came out for having no qualifying study and 20 GW for no dynamic model. The counts do not sum into each other: the screen examined more megawatts than the request list held, so the difference between them is not attrition.
Why It Stayed Quiet
The Price That Never Moved
Real-time prices at ERCOT's trading hubs averaged $34.49/MWh across the eight days around the record, July 18 to 25, 2026. Across the eight days around ERCOT's previous record, August 6 to 13, 2023, the hubs averaged $198.41 (Grid Flexibility analysis).
The averages hide the more interesting fact. The median hub observation was nearly identical in the two weeks, $26.73 in 2026 and $27.31 in 2023, while the 95th percentile differed by about sixteen times, $78.09 against $1,238.09. Both are unweighted distributions of hub-price observations rather than the cost of an hour.
That pattern is visible across the record series.
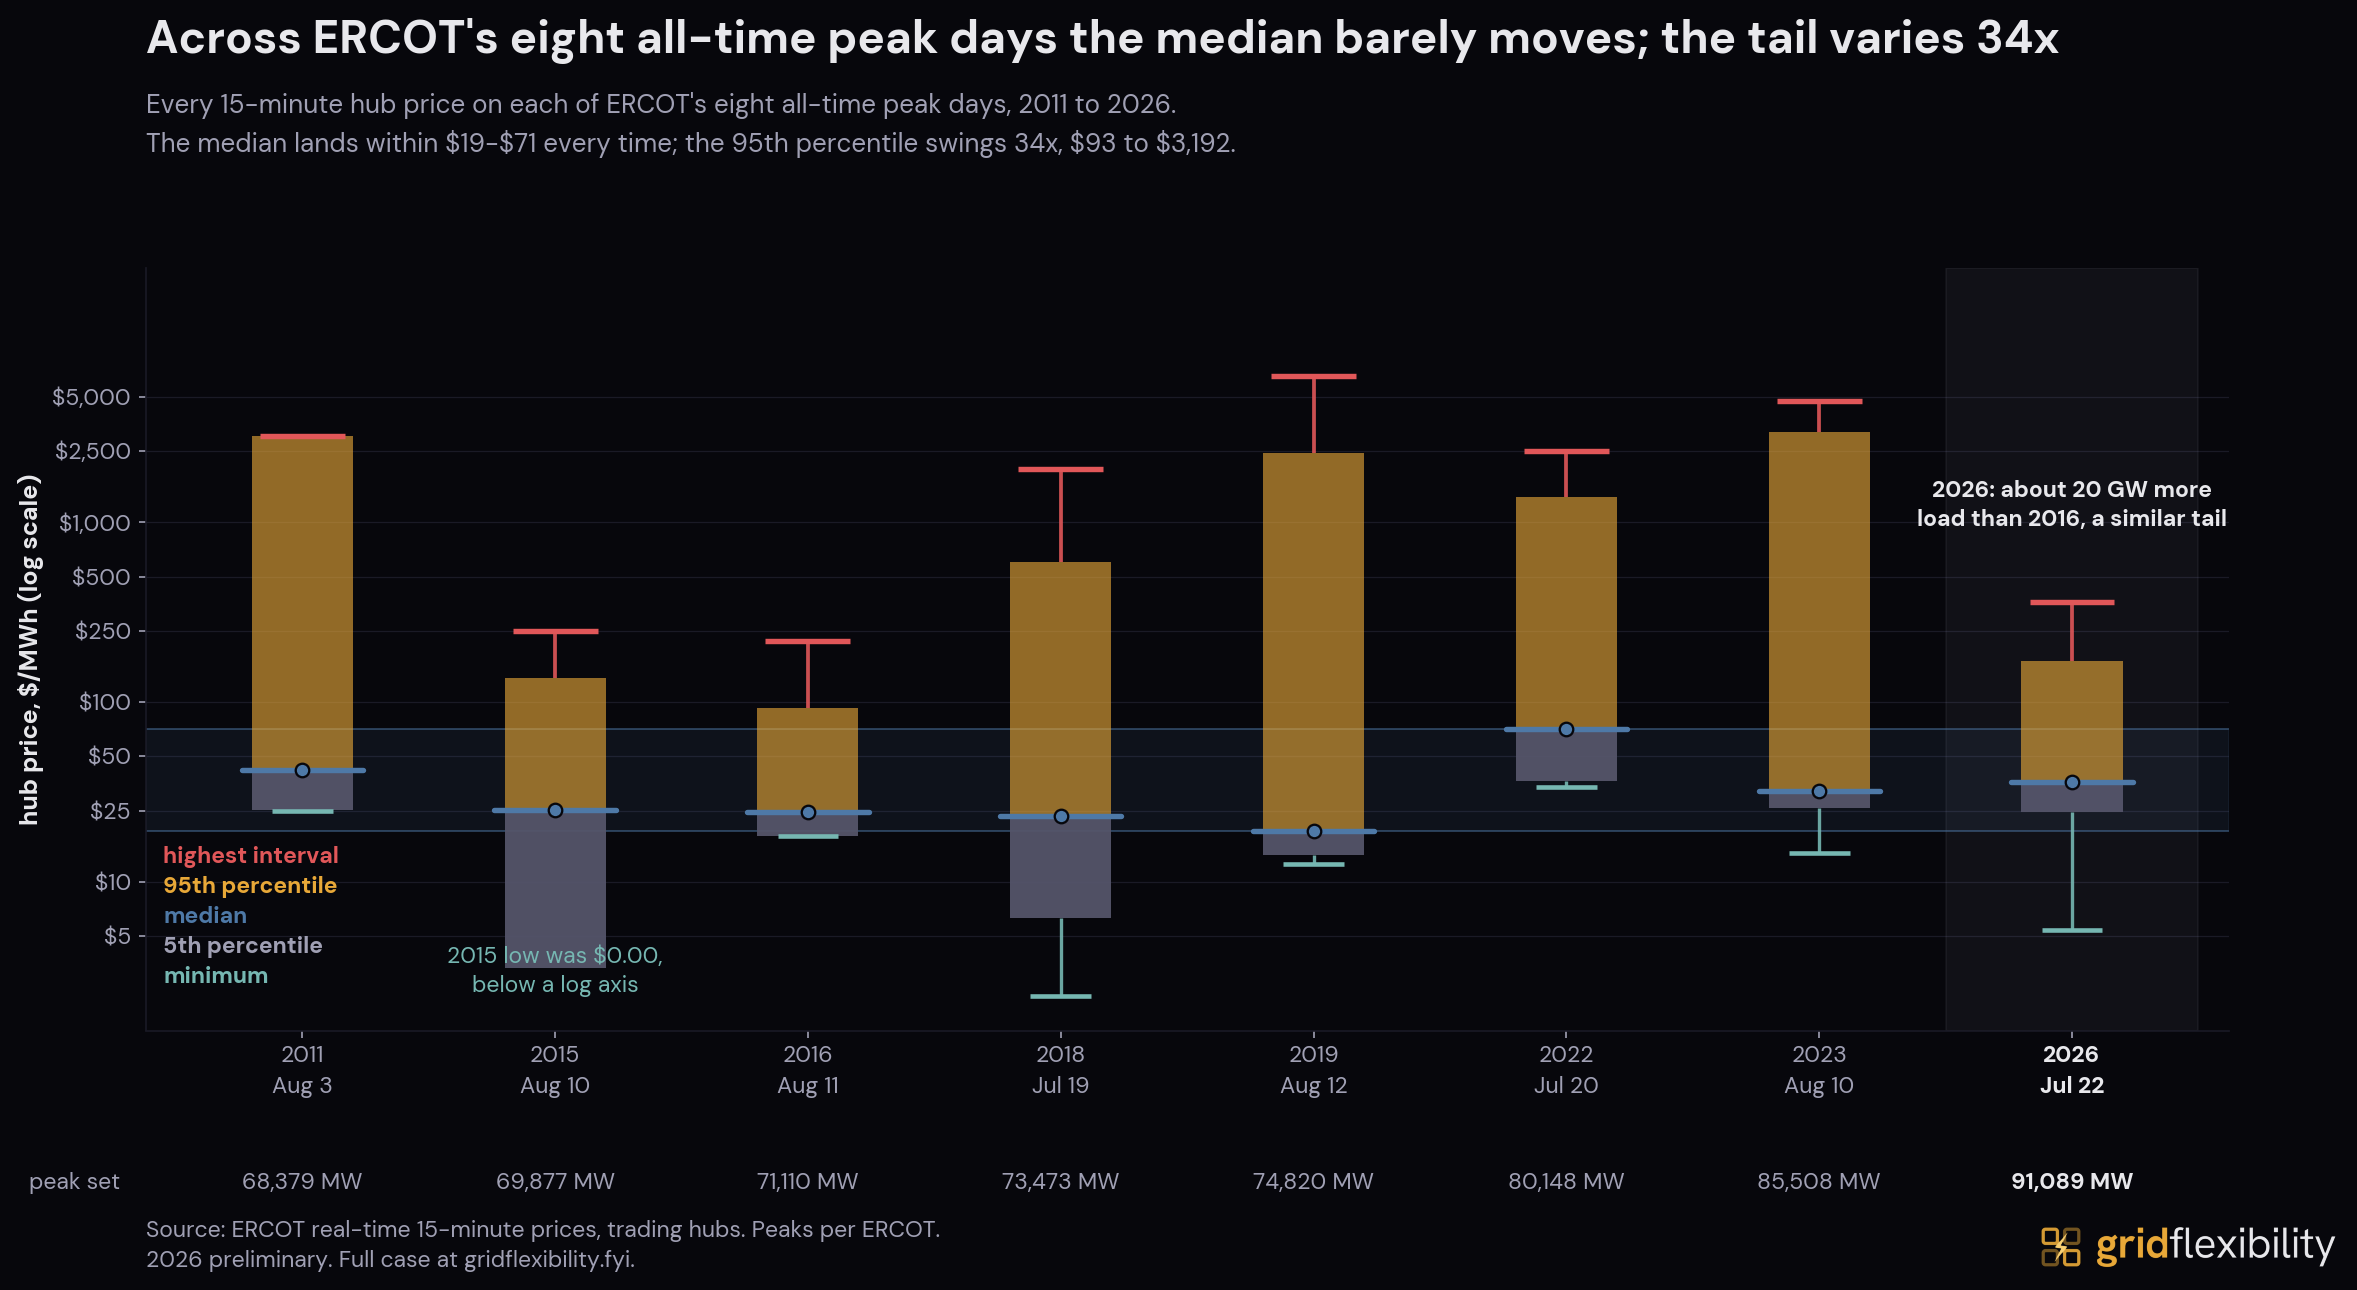
On all eight of ERCOT's all-time peak days since the 2010 move to nodal pricing, the median hub price lands between $19 and $71. The 95th percentile ranges from $93 in 2016 to $3,192 in 2023, a factor of 34. The typical price on a record day is relatively stable across fifteen years; the tail is where record days differ from each other.
2026 sits with the quiet end of that record. Its 95th percentile of $170 is higher than 2016's $93 and 2015's $137, and a fraction of 2018's $602 or 2022's $1,384. What separates it from those mid-2010s days is the load underneath: about 20 GW more than 2016 carried at a comparable price.
Across hourly distributions pooling the roughly 1,114 settlement points ERCOT tracks, the daily median of hourly medians stayed in a $21 to $38/MWh band, including on the two highest-load days. The highest hourly nodal P95 reached $362.23 on July 22 and was back near $47 by July 25, while daily peak demand remained within 1.6% of the record.
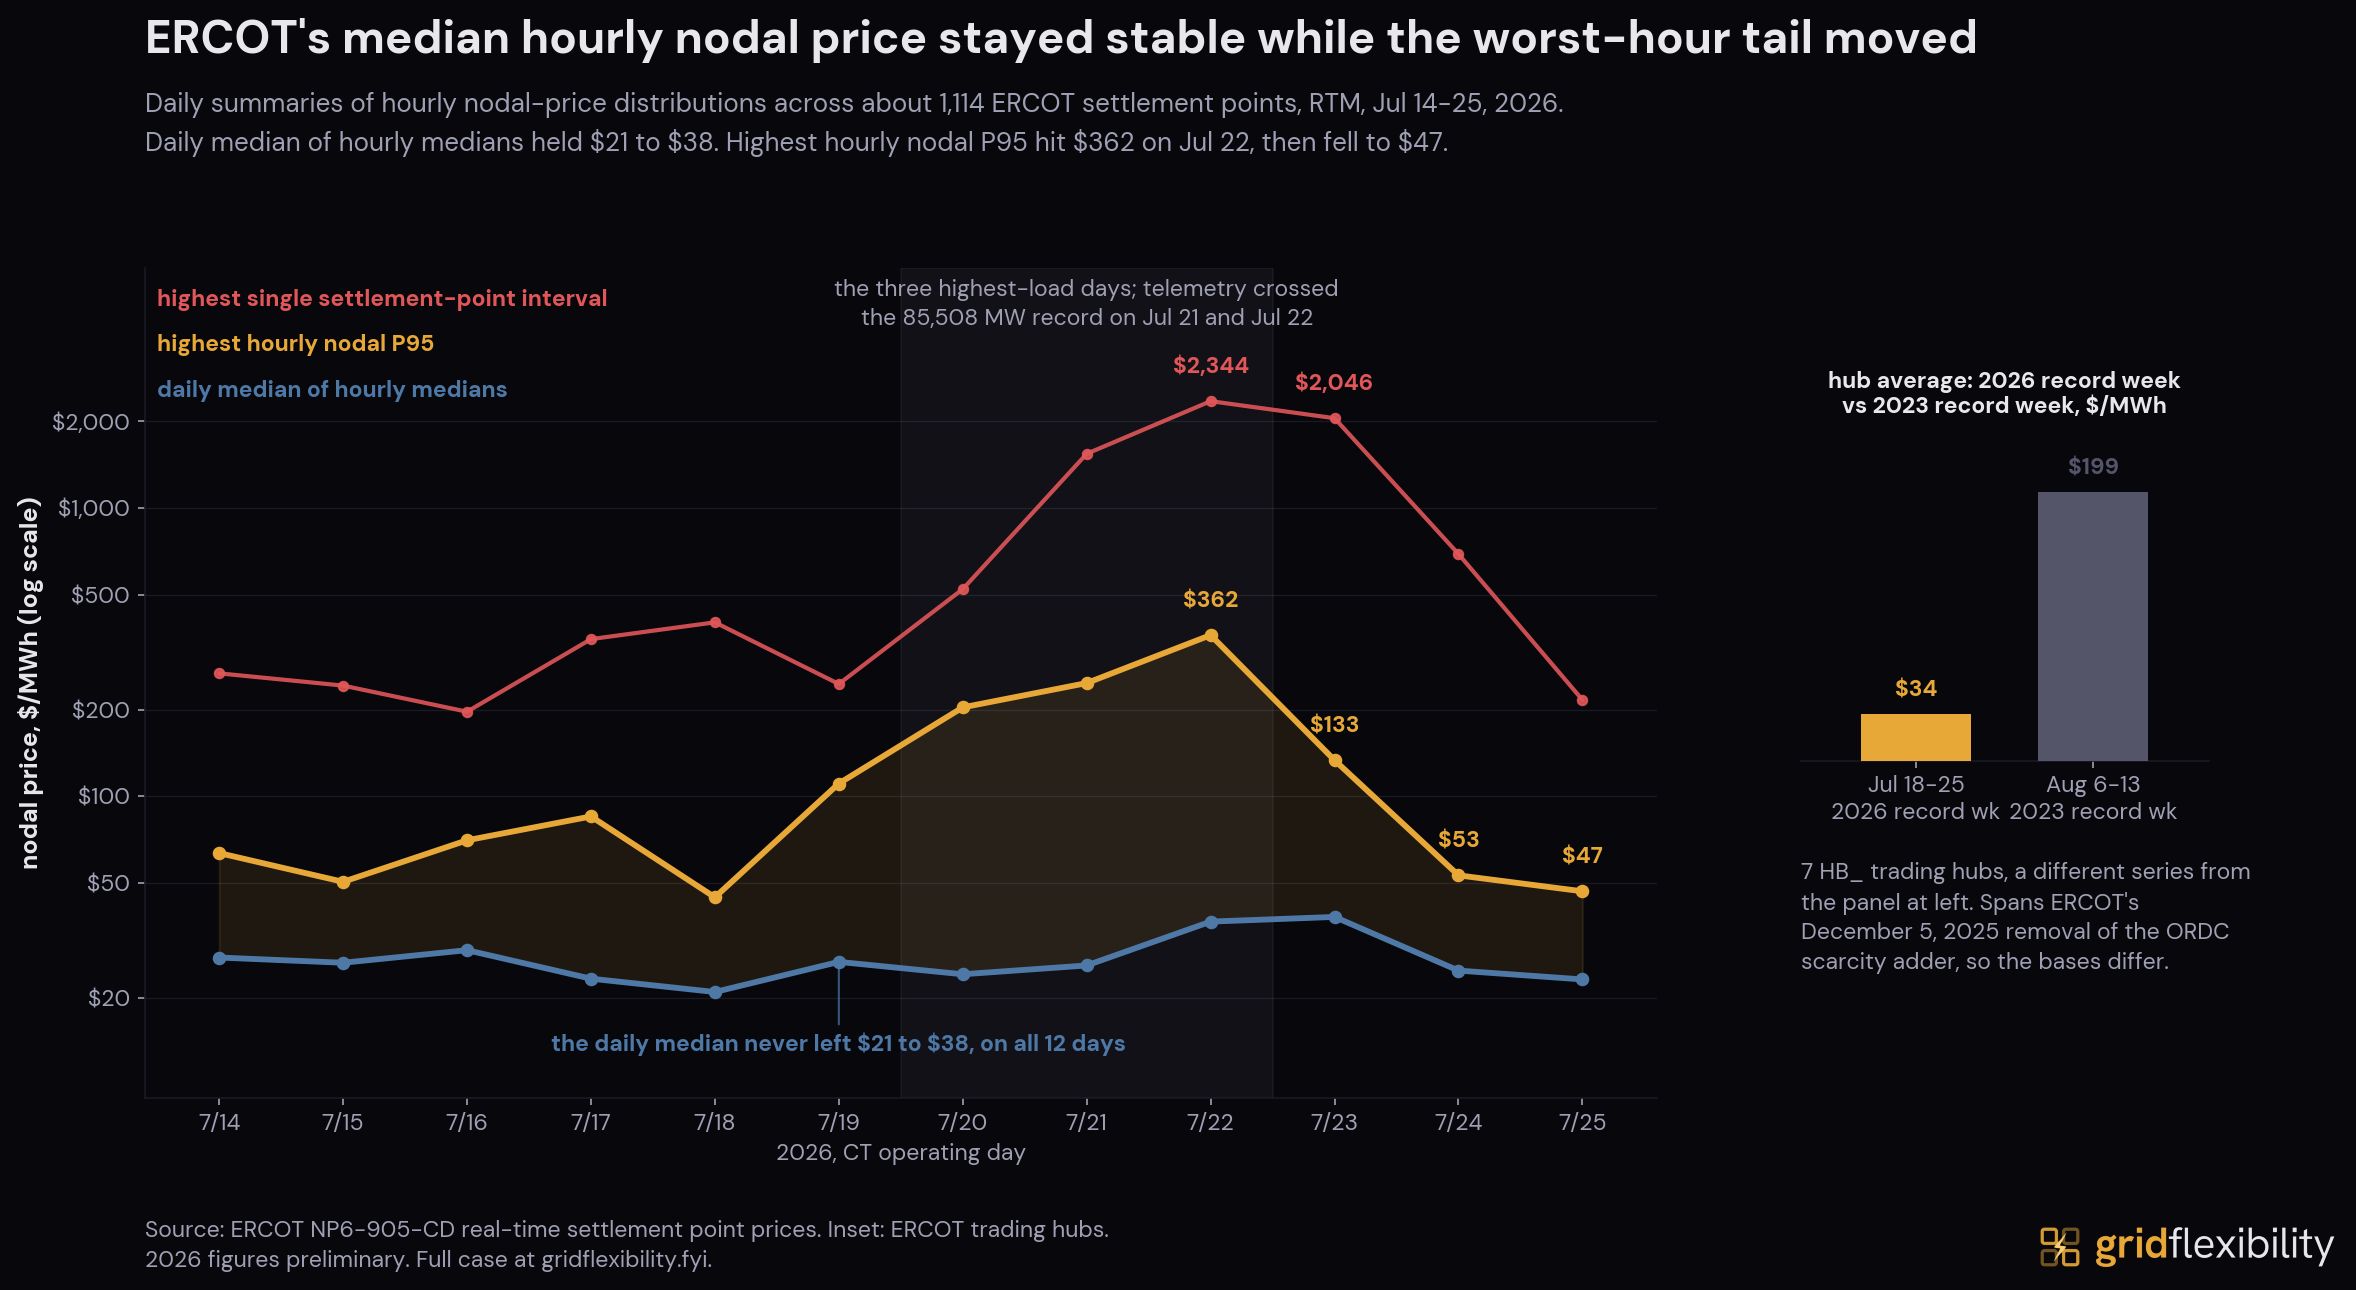
Across the eight days of the event window, three produced any interval with a settlement point above $1,000/MWh: July 21, 22, and 23, together 41 node-intervals out of 854,438. At its worst, on July 22, that reached 0.18% of settlement points in a single hour.
Those hours cluster in the evening, roughly 18:00 to 22:00 CT, after solar rolls off while cooling load is still high. July 22 was the sharpest, reaching a single-node maximum of $2,344.25. July 23 is the exception, with its highest prices before dawn. A 9.9 MW battery cleared $2,046/MWh in hour 19 on July 23: Carrizo Springs BESS in Dimmit County, 9.9 MWh of storage (EIA-860M). Every one of those prints was local and brief: a handful of settlement points for a handful of intervals, with the system-wide picture staying flat throughout (see “No emergency, and no notices”). Separating how much of each print was congestion, losses, energy, or reserve opportunity cost would take a component decomposition this case does not perform.
No Emergency, and No Notices
ERCOT declared no Energy Emergency Alert during the window, and its Emergency Response Service never deployed. ERS is a procured emergency product that can only be called once ERCOT enters an EEA, so its silence records that ERCOT never reached that condition.
The stronger finding sits one level up. ERCOT's Control Room Operations Messages log, which covers the window continuously, records no formal grid notice of any type: no Operating Condition Notice, Advisory, Watch, or Emergency Notice under ERCOT's Nodal Operating Guide, no public-facing Weather Watch, and no Energy Emergency Alert. What it carries instead is routine operating traffic, including Non-Spinning Reserve deployments on the record evening. An ERCOT spokesperson described the grid as operating under normal conditions in contemporaneous news coverage.
Setting an all-time record has usually come with ERCOT saying something. Of the 14 records since 2000, 11 had an emergency alert or a formal notice either issued that day or already running over it, and 10 had one issued on the day itself: a reserve-capacity Operating Condition Notice in 2005, 2010, 2015, and 2019; a reserve Advisory in 2009, 2010, 2016, 2018, and 2019; a system-wide extreme-heat OCN in 2003; an Energy Emergency Alert in effect at the record hour in 2011; and a transmission Watch in 2023. The oldest record, August 31, 2000, predates all four notice types.
Two of the ten ran the same sequence sixteen years apart. On August 23, 2010 ERCOT issued an OCN at 04:59 CT projecting a reserve capacity shortage for hours ending 16:00 through 18:00, added an Advisory at 13:47 as responsive reserve fell below 3,000 MW, and cancelled both that evening. On August 12, 2019 it issued an OCN at 05:00 CT projecting a shortage for hours ending 14:00 through 18:00, the record landed in hour ending 17:00, the Advisory followed at 13:50, and the next day ERCOT declared its first Energy Emergency Alert since January 2014.
Three records had nothing issued: August 3, 2004, July 20, 2022, and July 22, 2026. A week-long extreme-heat notice covering July 20, 2022 was already running. The 2004 entry is disputed: ERCOT's own market monitor puts that year's peak below 2003 (Methodology and basis). July 22, 2026 is the only confirmed record with nothing issued, nothing in effect, and no emergency alert.
ERCOT's log does carry two entries that month: an Advisory on July 4 for a geomagnetic disturbance and a Watch on July 9 for an HRUC-timeline deviation, 18 and 13 days before the record and unrelated to the demand event.
Winter Storm Uri makes the point from the other direction. Served load peaked at 69,692 MW on February 14, 2021, below the then-standing record of 74,820 MW, then fell to 54,523 MW and 46,797 MW over the following two days as ERCOT shed load. Later winters have carried up to 80,525 MW without incident (Grid Flexibility analysis). Uri was a supply-side failure, and load fell because ERCOT cut it.
The Battery Record at the Evening Peak
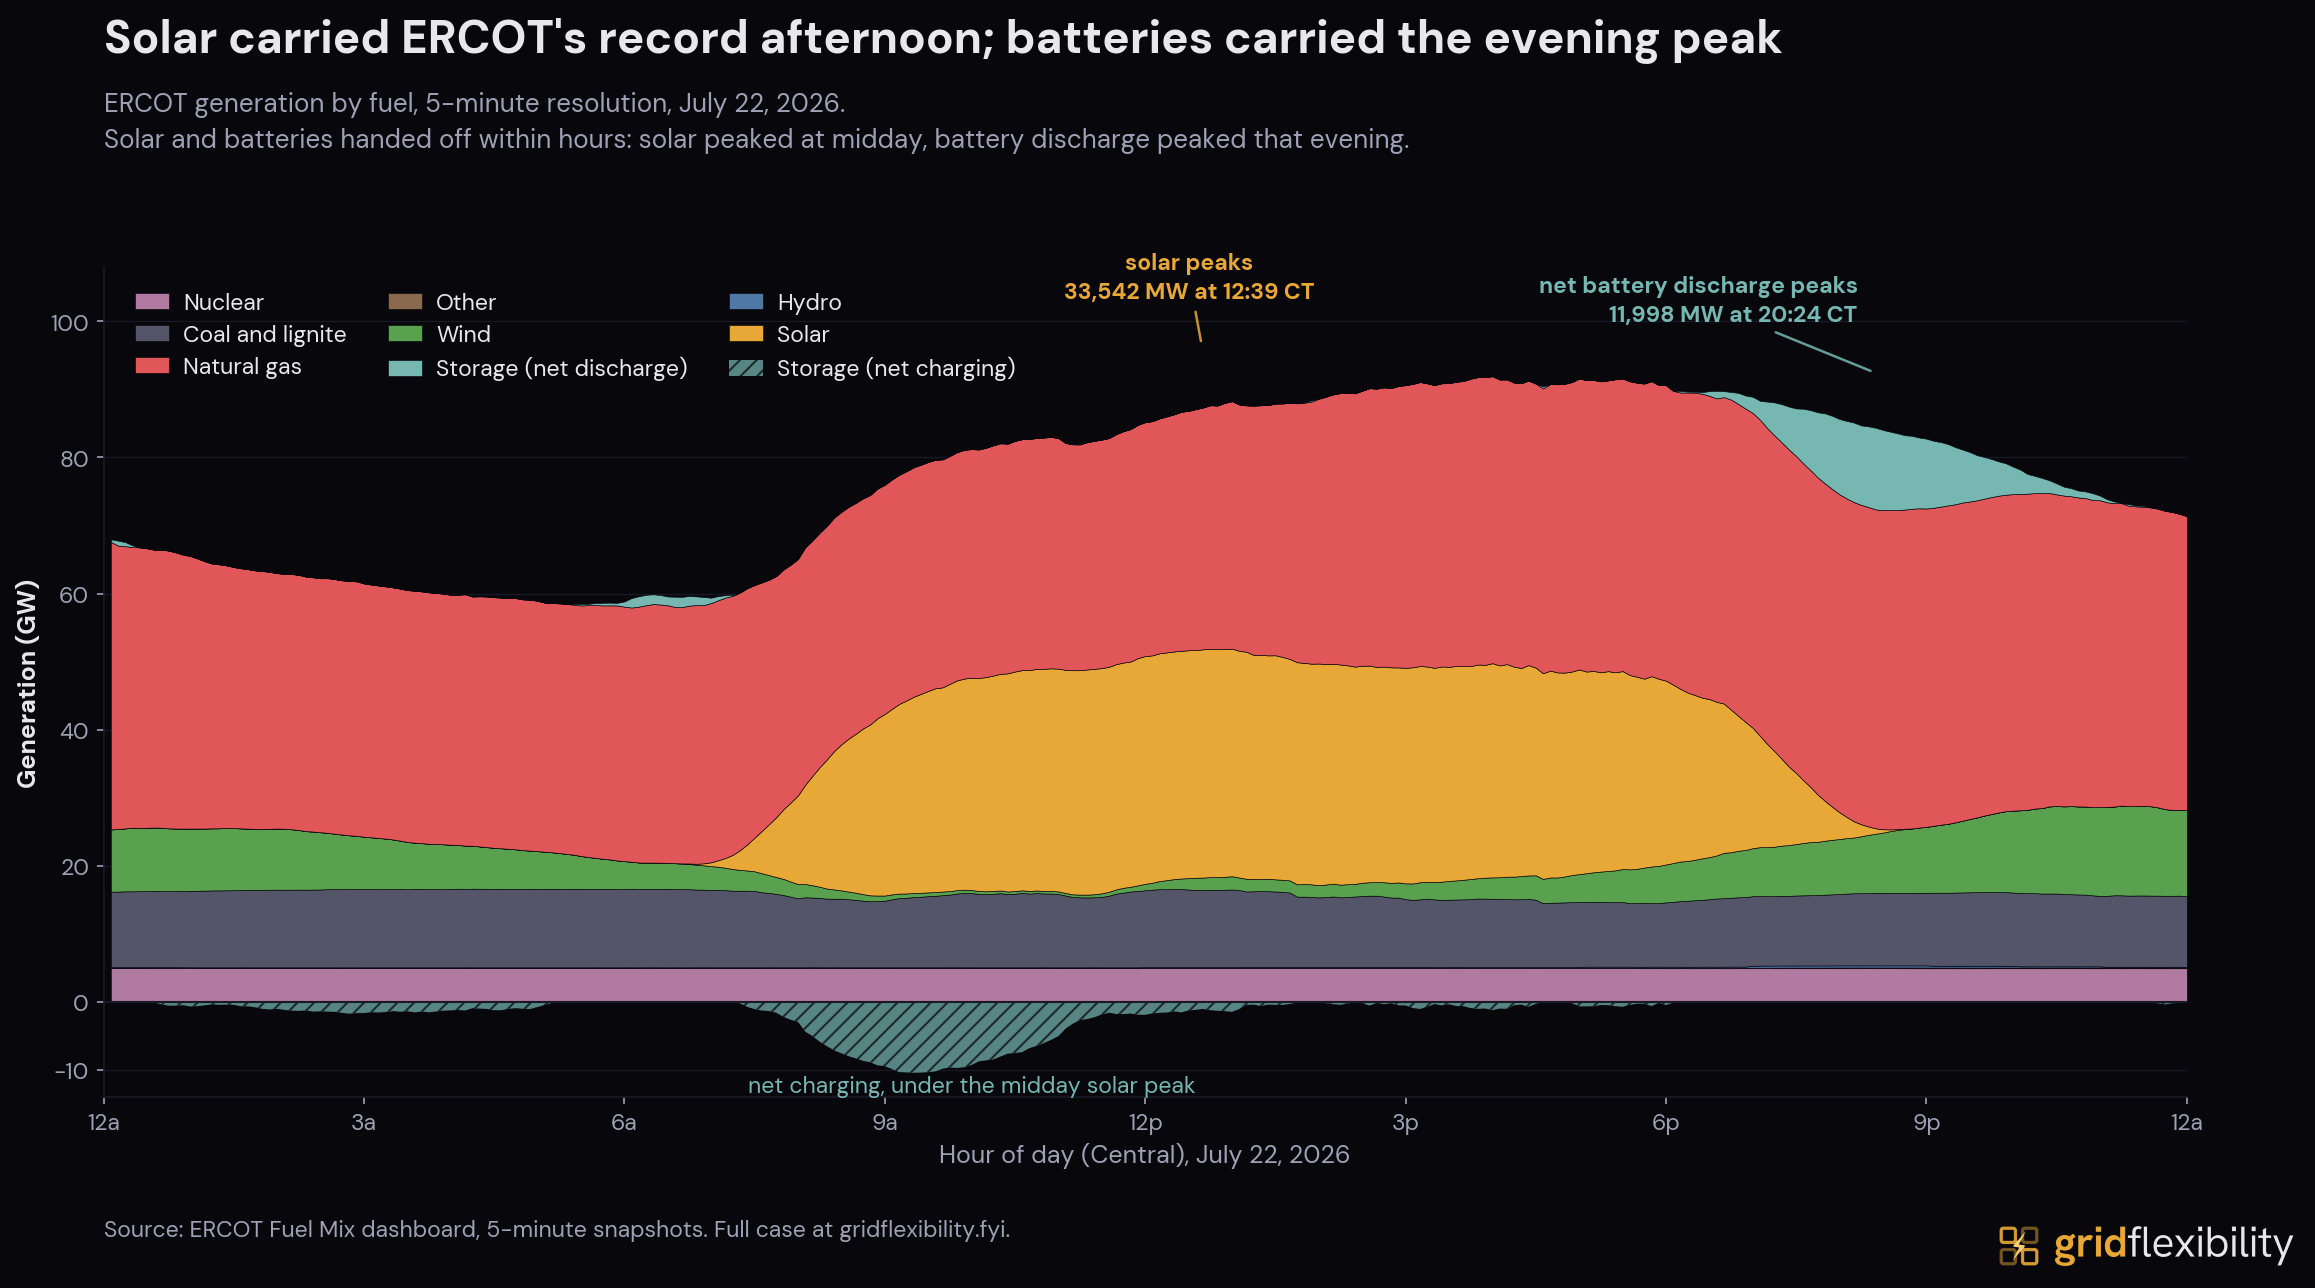
July 22 had three peaks and they landed in three different hours. Solar peaked at 33.5 GW at 12:39 CT. Demand peaked in the hour ending 18:00, with solar supplying 30.1 GW of it and the storage fleet drawing more power than it sent. Then at 20:24 CT, with solar down to 792 MW and system load below its daily high, ERCOT's ESR Integration Report recorded a 12,017 MW discharge, 14.11% of the load being served at that reading and, at the time, the fleet's own all-time record. It had first crossed 1,000 MW on January 9, 2024, thirty months earlier. ERCOT has since logged 12,097 MW on August 18 and 13,300 MW on August 23 (see the August 2026 postscript).
For this event, the solar, demand, and storage peaks were separated by hours.
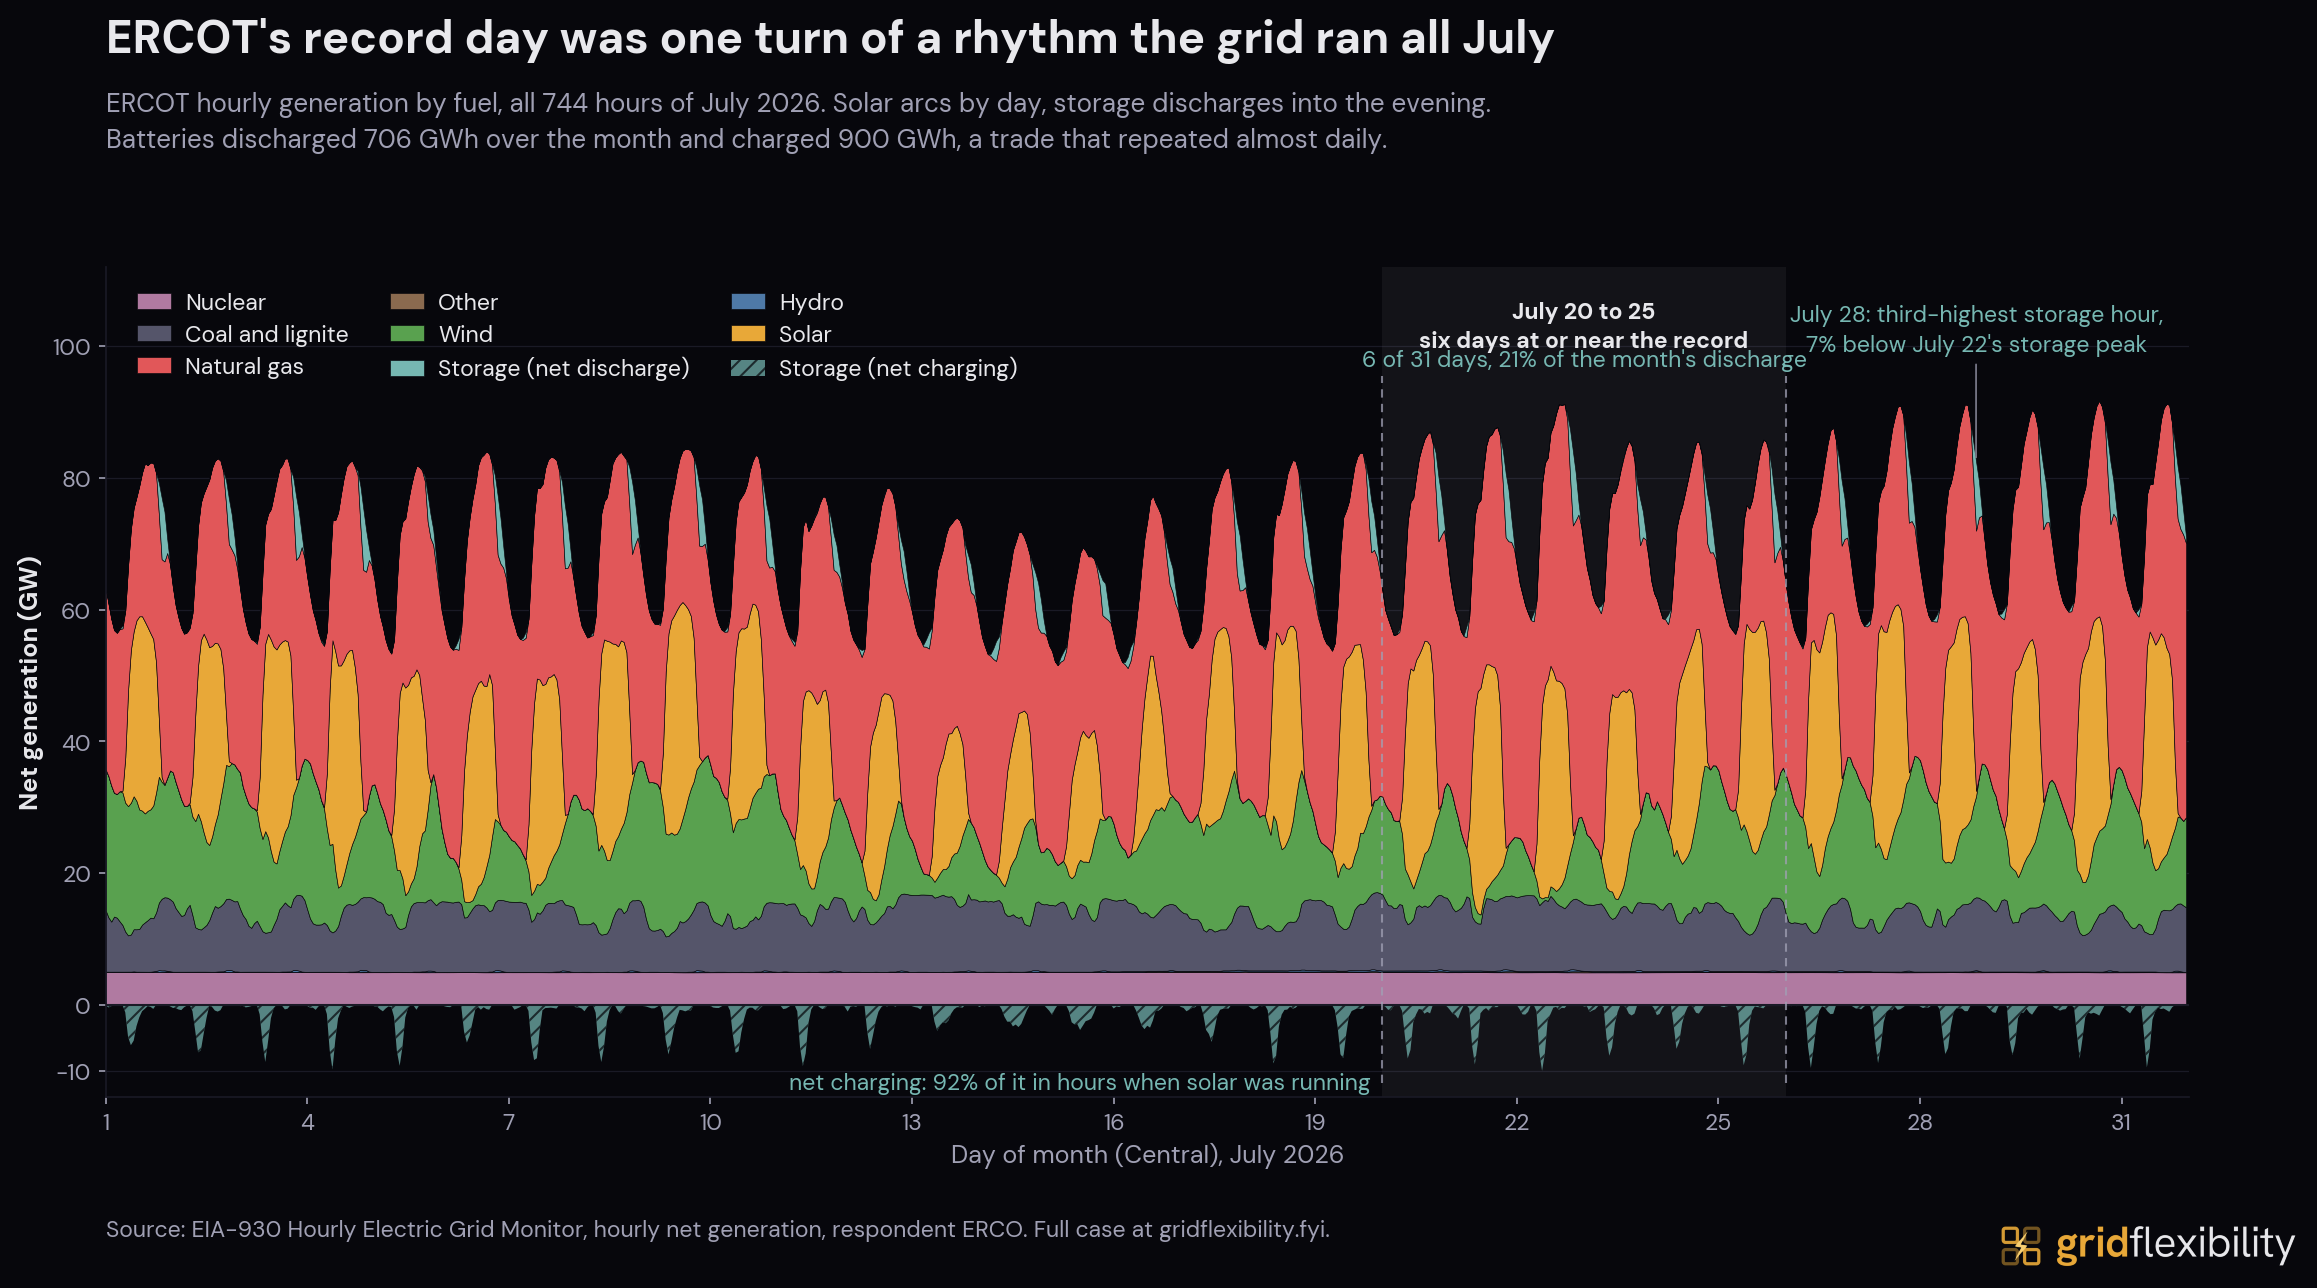
Over the full month the battery fleet discharged 706 GWh and charged 900 GWh, and July 22 was its largest discharge day at 29.8 GWh against a 22.8 GWh daily average for the month (EIA-930 hourly net generation).
What the Heat Took, and What the Dispatch Held Back
Two things hold solar below its nameplate: the heat itself, and curtailment.
The first is heat. On a clear 105 degree Fahrenheit afternoon the cells inside a utility-scale panel run near 150 degrees, and at that temperature the module ERCOT's own solar-profile study assumes gives up 16% to 19% of its DC output against its 77 degree lab rating.
Some of that never reaches the meter, for a reason built into how solar plants are sized. A plant carries roughly 30% more panel capacity than its inverters can convert, on ERCOT's own representative 1.30 ratio, because panels only hit their rating in ideal conditions and sizing the expensive equipment for a rare peak wastes it. Depending on irradiance and inverter state, that headroom can mask part of a module-level loss. Whether it masked anything on July 22, and how much, is not something ERCOT's public fleet trace can show.
The second is curtailment. That is a decision, not a property of the equipment. ERCOT calls a plant curtailed when its dispatch instruction holds output below what the plant reports it could produce. That is the number worth watching, because a curtailed megawatt is one a co-located battery or a flexible load could in principle be paid to take instead, where the location and the market allow it.
ERCOT publishes no curtailment figure. It has to be rebuilt from dispatch instructions, released 60 days after the operating day. The files for the record week posted between September 20 and 23, 2026. This case has not rebuilt the figure from them. No public source states how much solar ERCOT held back on July 22.
The Invisible Demand Side
ERCOT publishes its supply side by the hour and in gigawatts. Its demand side sorts into tiers by how much of it reaches the public record, and only the benchmark produces an event-week number.
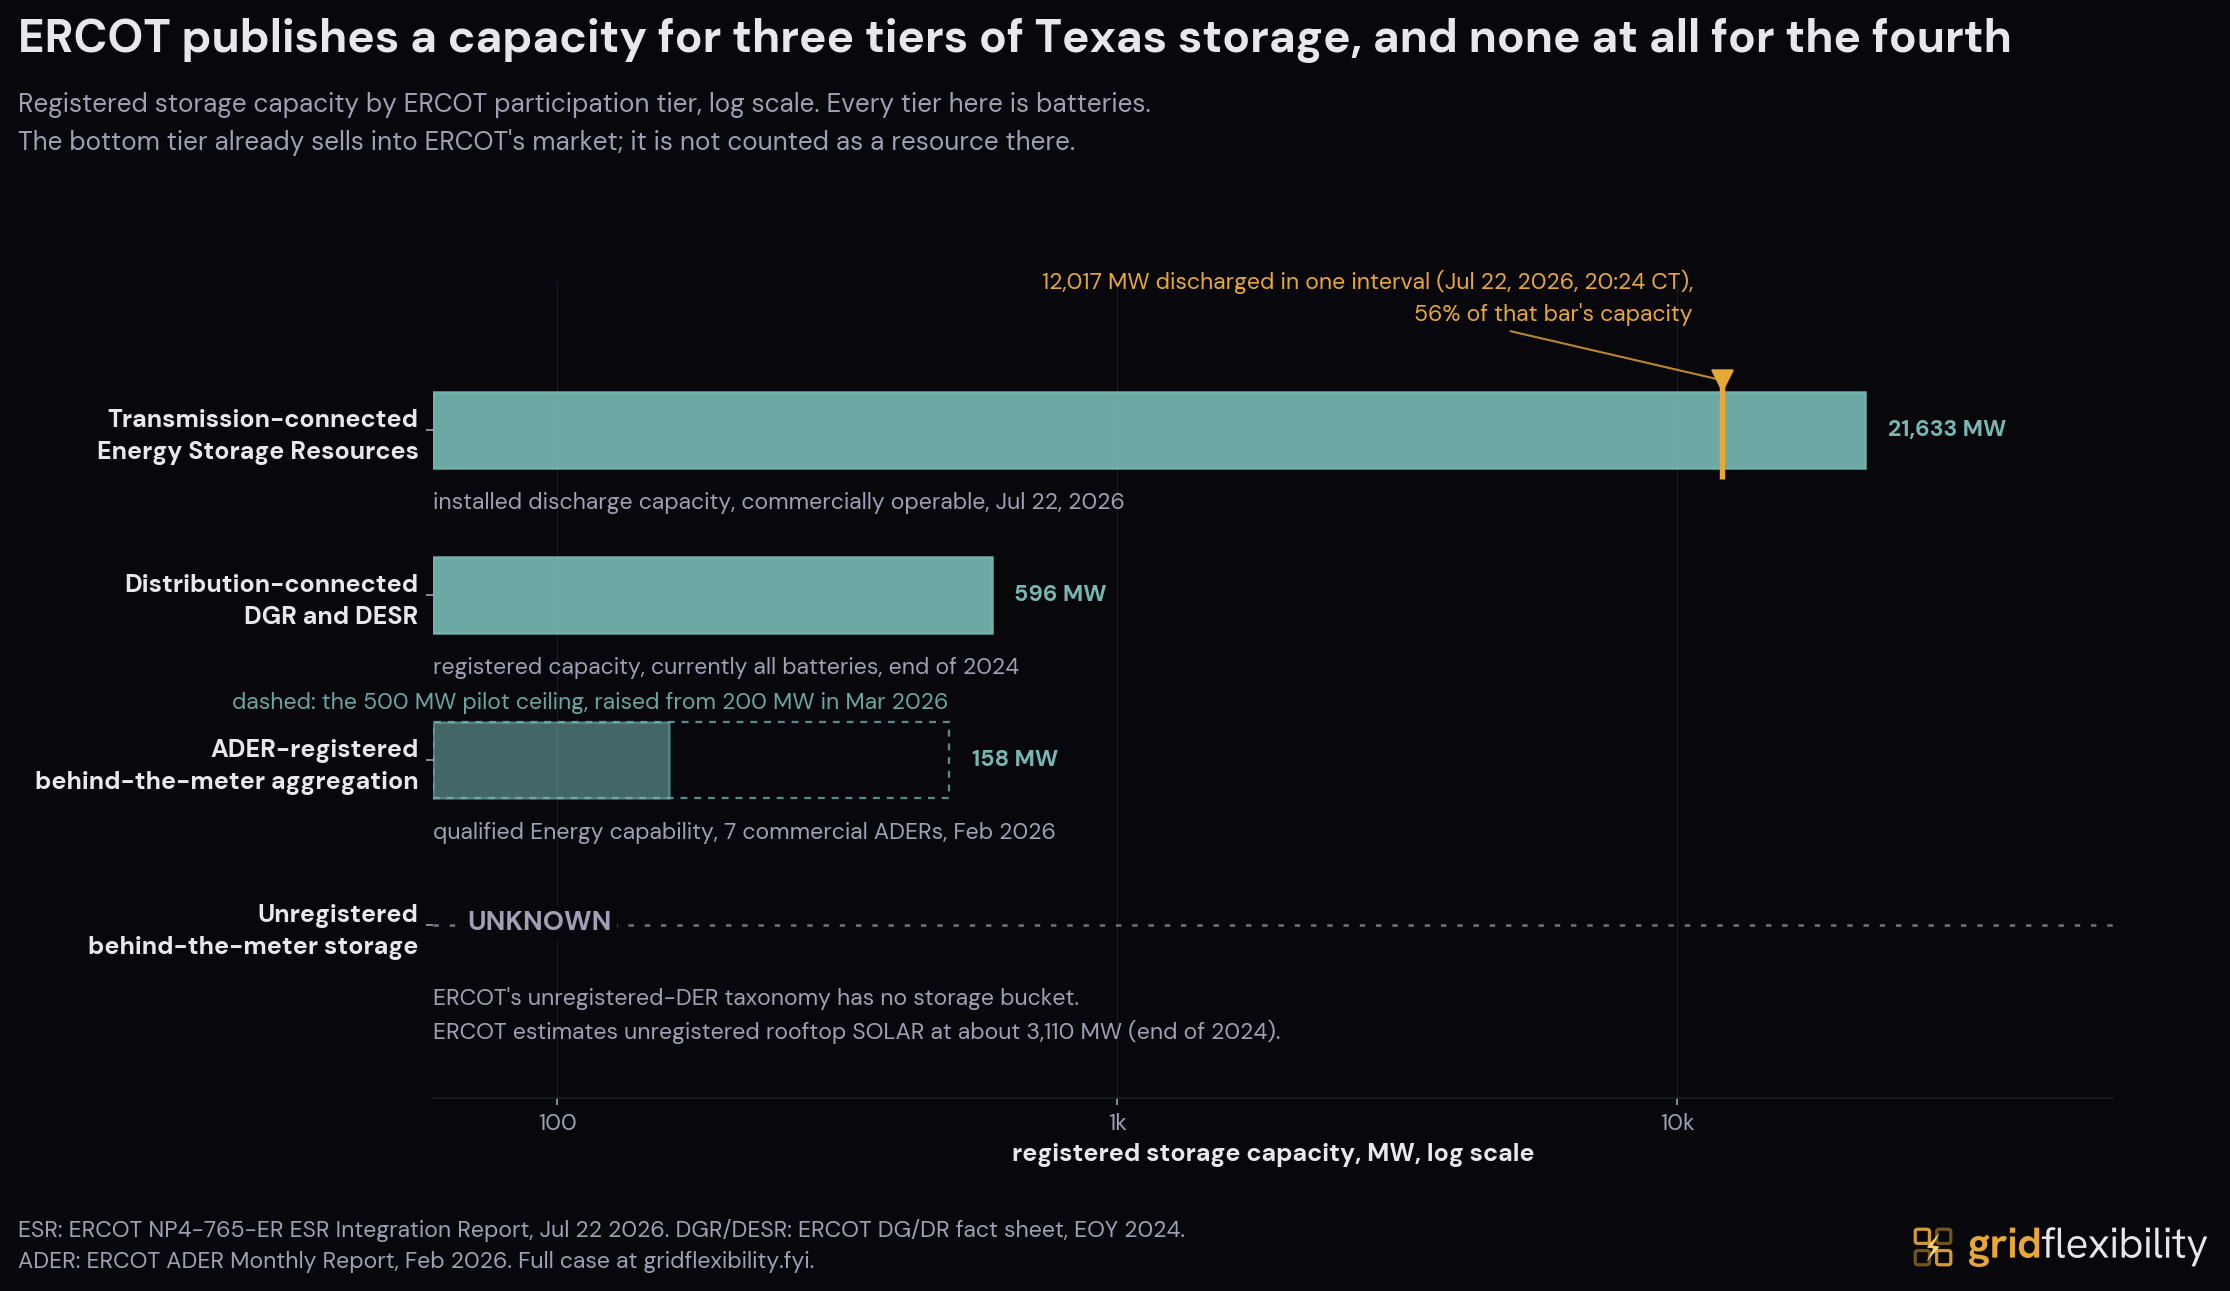
For scale, that benchmark is the 12,017 MW storage discharge above: front-of-meter, and reported publicly at 5-minute resolution on the day. Every category below it is reported later, in less detail, or not at all.
Capacity known, event output unknown.
- About 3,340 MW of small-scale solar PV across Texas as of May 2026, up 6.4% in a year from 3,137 MW (EIA). ERCOT's own rooftop count for its own footprint, last updated at the end of 2024, is about 3,110 MW, a narrower measure of a smaller area. Rooftop output lowers metered load instead of registering as generation, so the record figures above are already net of whatever sat behind them.
- 596 MW of distribution-connected batteries (Distribution Generation Resources and Distribution Energy Storage Resources, at 60 kV and below), registered, dispatched, and settled for energy and ancillary services.
Registered and dispatchable, reported on a lag.
- 158.2 MW of qualified Energy capacity across seven commercial aggregations in ERCOT's ADER pilot as of February 2026, roughly 1.3% of the discharge record. ADER is the channel ERCOT has built for an aggregation of home batteries to take Dispatch Instructions; whether it is the only such channel is not something this case can source. ADER dispatch reporting now runs about two to five months behind. The four monthly reports ERCOT posted on September 2, 2026 carry dispatch participation through June, May, April, and March 2026. The latest report's summary of qualified capacity runs through August 2026. No event-specific dispatch figure for the July window had posted as of October 1, 2026.
Reaching the market through someone else's registration.
- No public total: home batteries run as a single fleet by the company that sells the household its electricity. This tier is unmeasurable by construction rather than by oversight: it sits below every counter ERCOT publishes, so no amount of reading ERCOT data will size it. Base Power is one such fleet, reported to have built its own battery hardware and software and to bid the fleet into wholesale markets (Canary Media). How such a fleet is represented to ERCOT is not something this case can source: no ERCOT, PUCT, or company primary it holds describes the registration path, and no public total quantifies what the channel did during the event week. The measurable end of the same ladder gives the scale of what is missing. As of October 1, 2026, ERCOT's definition of a distributed generator names energy storage systems, but its unregistered-generator section lists no storage category.
Every one of these channels existed by the record week, and this section has just put a capacity number on three of them. What none of the public sources reviewed here quantifies is what any of them did during it. The public record carries ERCOT's front-of-meter batteries to the megawatt at 20:24 CT, and carries the demand side as standing capacity, months late, or not at all. Someone measured all of it. The companies that own these devices meter them, and the retailers that dispatch them settle on that data. None of it reaches the public in time to matter. The demand side did not go missing on July 22. It stayed private.
Our PJM heat wave case covers a July 2026 peak that ran the other way, with the demand side dispatched and reported. Our Grid Flexibility Index rates ERCOT “Monitor.”
What Is Coming
What to Watch, with Dates
What would test this fleet, and when:
| When | What to watch |
|---|---|
| Through Sep 2026 | The rest of the cooling season. Stress this week concentrated in three-hour evening windows across a handful of days. The sustained multi-day depletion the August 2011 heat wave produced is the case this fleet has not faced at today's load, and there is season left to run it. August ran part of that case: see the August 2026 postscript. |
| Sep 20-23, 2026 | The dispatch record for the window. ERCOT's 60-day SCED disclosures release each operating day 60 days later, so July 22 posted September 20 and the July 25 end of the window posted September 23. Real curtailment for the record week can now be computed from them. |
| Late Sep 2026 | The record becomes settled. ERCOT's Demand and Energy Report moves to final settlement 55 days after each operating day and publishes roughly two months after month end, so July 2026 settles from mid-September. Until then every 2026 reading here, including the 91,089 MW peak, can still move. |
| Dec 15, 2026 | ERCOT's first reliability-standard assessment. The PUCT's reliability standard (16 TAC Section 25.508, effective September 2024) sets explicit frequency, duration, and magnitude criteria for loss-of-load events. ERCOT was scheduled to load Batch Zero's base-load forecast into the model on August 21 and files its probabilistic simulation results on December 15. Stakeholder review and a Commission decision follow, and neither has a date yet. |
| Through 2029 | Far West transmission. As of February 2026, ERCOT put Far West Texas's maximum reliable load-serving capability under critical low-renewable conditions at about 9,500 MW, with roughly 1,000 MW of relief from the Delaware Basin Stage 2 project in June 2026 and no further major import relief until the end of 2029. Far West is the zone that grew 75% since 2019. |
| Not yet dated | The Dispatchable Reliability Reserve Service comes online. NPRR1309 won PUCT approval on July 9, 2026, nine days before this window opened, and contributed nothing here. ERCOT's July 2026 status report still carries its implementation date as to be determined. NPRR1340, which would let energy storage provide the service, is pending at committee. |
Postscript: August 2026
Added August 24, 2026. The July 17 to 25 analysis above is unchanged by it, with one exception, noted below, where August overtook a figure this article published.
August kept setting records, and none of them was the all-time peak. ERCOT's 2026 peak demand records page lists seven separate days on which August 2026 set a new record for the month, climbing from 87,016 MW on August 4 to 90,353 MW on August 20. Its weekend table runs higher still, to 90,411 MW on August 23, a Sunday that its own August table does not carry. That highest August value sits 678 MW, or 0.7%, below the 91,089 MW of July 22 on the same instrument. As of the August 25 capture, ERCOT's all-time records page still carried July 22 as the current record with no August row.#
Re-checked September 2, 2026. ERCOT has since revised July 22 to 91,134 MW on the 2026 page and left 91,089 MW standing on the all-time page, so its two pages now give two figures for the same day, 45 MW apart, and neither carries a revision note. The 2026 page's own last-updated stamp still reads August 21.# This article keeps 91,089 MW. It is the figure on ERCOT's all-time records page and the figure this project reproduces independently from ERCOT's hourly zonal load archive, at 91,089.5 MW in the hour ending 18:00 CT. Both values are unofficial by ERCOT's own footnote, which says records stay unofficial until final settlement, and 45 MW is 0.05% either way. Neither changes anything here.
What August did was hold near that level rather than pass it. On EIA-930 hourly demand for ERCOT, a federal collection used here as a cross-check because it reports every day rather than only record-setting ones, August 17 through 28 held twelve consecutive days at or above 97% of the July 22 reading.# Using this project's own 97% cutoff, which is not an ERCOT or EIA classification, that is the longest such run of 2026 so far. The conclusion holds at every cutoff from 94 to 99%, though the run is longer at the looser ones: 21 days at 94 and 95%, 20 at 96%, 10 at 98%. The record day itself stood alone, and the next longest run was five days, July 27 to 31, after this article's window had closed.#
One July figure in this article has been overtaken. The 12,017 MW storage discharge of July 22 was the fleet's all-time record when it was set, and ERCOT's own ESR Integration Report now carries 13,300 MW at 19:45 CT on August 23, at 15.35% of load. The intermediate step is in the same daily product: the report for August 18 sets 12,097 MW, and the August 21 and August 22 reports still carry it, so July 22 was passed first by 80 MW and then by 1,283 MW, or 10.7%.# Both August readings came in the 19:00 to 20:00 CT hour, on days whose demand peaks stayed below July 22, and both are the same gross ESR-generator basis as the July figure. The front-of-meter fleet is discharging more into the evening than it did at the record, without a record to do it into. That is a supply-side change, on the same wholesale-registered storage Section 5 describes, rather than anything the demand side did.
ERCOT also issued a notice this time. On August 19 at 10:00 CT it issued an Operating Condition Notice for an extreme hot weather event, covering August 20 through 25 in the North Central and South Central weather zones, citing predicted high temperatures. Through August 23, the last day the control-room log capture covers, nothing escalated past it: no Advisory, no Watch, no Energy Emergency Alert, and no conservation appeal.#
August sharpens the distinction between peak load and the criteria ERCOT's notices actually run on. ERCOT issued an extreme-heat notice ahead of a lower-peak event, off a temperature forecast, and issued nothing for the higher July peak. The two observations do not establish why ERCOT treated the periods differently, and the public record does not say.
The sustained multi-day case the table above says this fleet has not faced at today's load is now partly run, and the cooling season has weeks left in it. Every August figure here is preliminary, under the same standing ERCOT disclaimer that records are unofficial until final settlements occur, and ERCOT's Demand and Energy Report remains the authority that moves the July record to final settlement from mid-September.
Dockets and Rules to Watch
The ERCOT and PUCT proceedings that will shape how the next week like this one goes, current as of July 2026.
| Item | Date | What it does | Status on July 22, 2026 | Next milestone as of July 22, 2026 |
|---|---|---|---|---|
| Large Load Demand Management Service, PUCT Project 58482, new 16 TAC 25.521 | Proposed July 30, 2026 | Creates a competitively procured ERCOT service paying loads of 75 MW and above to reduce ahead of an anticipated emergency. The statute bars any large load that already curtails on wholesale price | Not yet proposed on the record date | Comments due September 4, 2026; adoption expected November 2026 |
| Transmission cost allocation, PUCT Project 58000 | Proposed July 9, 2026 | Replaces the four coincident peak method with twelve, and floors large-load billing demand at the greater of contracted peak, prior-year non-coincident peak, or 12CP. That would end the transmission-bill value of concentrating curtailment into four summer coincident-peak intervals, which is the behavior 4CP has rewarded since it was introduced | In public comment | Comments due August 11, 2026; adoption December 2026, against a December 31, 2026 statutory deadline |
| Large-load interconnection standards, PUCT Project 58481, new 16 TAC 25.194 | Proposed March 12, 2026 | Sets what a large load must post and disclose to interconnect at 75 MW and above. The intermediate agreement requires financial security of $50,000 per MW. The standard agreement requires the greater of $50,000 per MW of contracted peak or the costs allocated for system upgrades. Both require site control. The standard agreement adds contribution in aid of construction for direct interconnection costs. The proposed non-refundable interconnection fee was dropped | Adopted with changes September 18, 2026 | The adopted rule will be republished |
| Provisional Controllable Load Resource, NPRR1325, and PGRR145 | Approved June 18, 2026 | Creates a load class ERCOT can curtail under local grid stress in exchange for faster study treatment, the most directly flexibility-relevant thing SB6 has produced | Not in effect. The July 11, 2026 effective date covers Batch Zero and Withdrawal-Limited Private Use Networks; PCLR takes effect on system implementation, ranked to 2027 | Curtailment assumptions were scheduled to enter ERCOT's reliability model August 21, 2026; not re-checked since |
| Batch Zero large-load study | PUCT approval June 18, 2026 | Replaces serial large-load handling with one systemwide study for requests of 75 MW and above | Applicant deadline closed July 10; no project delivering capability | The August 7, 2026 classification deadline was excused: ERCOT filed for good cause exceptions in PUCT Project 59142 on August 10 and the PUCT granted them on August 20, 2026. After Governor Abbott's August 3 directive, ERCOT paused approvals to energize data center and crypto mining facilities of 75 MW and above. It issued provisional classifications on September 3, 2026, with 204 projects conditionally included as base load, 158 as studied load, and 373 excluded. Final classification follows an eligibility verification and audit, and ERCOT's report on it is due December 10, 2026. ERCOT has not set a revised date for the study results originally due April 9, 2027 |
| PUCT reliability standard, 16 TAC 25.508 | Effective September 2024 | Sets frequency, duration, and magnitude criteria for loss-of-load events | In effect; first assessment underway | ERCOT files simulation results December 15, 2026; stakeholder and Commission review follow, both undated |
| Dispatchable Reliability Reserve Service, NPRR1309, with NPRR1340 and NPRR1310 | PUCT approval July 9, 2026 | Adds a reserve ERCOT procures to manage uncertainty and reduce reliability unit commitments, deployed on a two-hour ramp. NPRR1340 and NPRR1310 would each let energy storage provide it | Approved nine days before the window; ERCOT's own estimate is 20 to 30 months to implement | Implementation date still to be determined; both storage changes pending at committee |
| Emergency Response Service changes, NPRR1337 | Filed May 26, 2026 | Revises Emergency Response Service qualification and how availability is measured | ERCOT Board recommended approval September 15, 2026 | PUCT consideration |
| Permian Basin Reliability Plan and 765 kV import paths, PUCT Project 55718 | Plan approved October 7, 2024; voltage decided April 2025 | Local projects plus three 765 kV import paths into the Far West. The five 345 kV alternatives were retired by the April 2025 order | Approved; most paths not in service | Delaware Basin Stage 2 added about 1,000 MW June 2026; no further major import relief until end of 2029 |
- Date
- Proposed July 30, 2026
- What it does
- Creates a competitively procured ERCOT service paying loads of 75 MW and above to reduce ahead of an anticipated emergency. The statute bars any large load that already curtails on wholesale price
- Status on July 22, 2026
- Not yet proposed on the record date
- Next milestone as of July 22, 2026
- Comments due September 4, 2026; adoption expected November 2026
- Date
- Proposed July 9, 2026
- What it does
- Replaces the four coincident peak method with twelve, and floors large-load billing demand at the greater of contracted peak, prior-year non-coincident peak, or 12CP. That would end the transmission-bill value of concentrating curtailment into four summer coincident-peak intervals, which is the behavior 4CP has rewarded since it was introduced
- Status on July 22, 2026
- In public comment
- Next milestone as of July 22, 2026
- Comments due August 11, 2026; adoption December 2026, against a December 31, 2026 statutory deadline
- Date
- Proposed March 12, 2026
- What it does
- Sets what a large load must post and disclose to interconnect at 75 MW and above. The intermediate agreement requires financial security of $50,000 per MW. The standard agreement requires the greater of $50,000 per MW of contracted peak or the costs allocated for system upgrades. Both require site control. The standard agreement adds contribution in aid of construction for direct interconnection costs. The proposed non-refundable interconnection fee was dropped
- Status on July 22, 2026
- Adopted with changes September 18, 2026
- Next milestone as of July 22, 2026
- The adopted rule will be republished
- Date
- Approved June 18, 2026
- What it does
- Creates a load class ERCOT can curtail under local grid stress in exchange for faster study treatment, the most directly flexibility-relevant thing SB6 has produced
- Status on July 22, 2026
- Not in effect. The July 11, 2026 effective date covers Batch Zero and Withdrawal-Limited Private Use Networks; PCLR takes effect on system implementation, ranked to 2027
- Next milestone as of July 22, 2026
- Curtailment assumptions were scheduled to enter ERCOT's reliability model August 21, 2026; not re-checked since
- Date
- PUCT approval June 18, 2026
- What it does
- Replaces serial large-load handling with one systemwide study for requests of 75 MW and above
- Status on July 22, 2026
- Applicant deadline closed July 10; no project delivering capability
- Next milestone as of July 22, 2026
- The August 7, 2026 classification deadline was excused: ERCOT filed for good cause exceptions in PUCT Project 59142 on August 10 and the PUCT granted them on August 20, 2026. After Governor Abbott's August 3 directive, ERCOT paused approvals to energize data center and crypto mining facilities of 75 MW and above. It issued provisional classifications on September 3, 2026, with 204 projects conditionally included as base load, 158 as studied load, and 373 excluded. Final classification follows an eligibility verification and audit, and ERCOT's report on it is due December 10, 2026. ERCOT has not set a revised date for the study results originally due April 9, 2027
- Date
- Effective September 2024
- What it does
- Sets frequency, duration, and magnitude criteria for loss-of-load events
- Status on July 22, 2026
- In effect; first assessment underway
- Next milestone as of July 22, 2026
- ERCOT files simulation results December 15, 2026; stakeholder and Commission review follow, both undated
- Date
- PUCT approval July 9, 2026
- What it does
- Adds a reserve ERCOT procures to manage uncertainty and reduce reliability unit commitments, deployed on a two-hour ramp. NPRR1340 and NPRR1310 would each let energy storage provide it
- Status on July 22, 2026
- Approved nine days before the window; ERCOT's own estimate is 20 to 30 months to implement
- Next milestone as of July 22, 2026
- Implementation date still to be determined; both storage changes pending at committee
- Date
- Filed May 26, 2026
- What it does
- Revises Emergency Response Service qualification and how availability is measured
- Status on July 22, 2026
- ERCOT Board recommended approval September 15, 2026
- Next milestone as of July 22, 2026
- PUCT consideration
- Date
- Plan approved October 7, 2024; voltage decided April 2025
- What it does
- Local projects plus three 765 kV import paths into the Far West. The five 345 kV alternatives were retired by the April 2025 order
- Status on July 22, 2026
- Approved; most paths not in service
- Next milestone as of July 22, 2026
- Delaware Basin Stage 2 added about 1,000 MW June 2026; no further major import relief until end of 2029
The status column is checked as of July 22, 2026, and several of the next-step dates above have since passed. Three rows have been re-verified against primaries on October 1, 2026 and are corrected in place: Batch Zero (a PUCT order excused the August 7 classification deadline on August 20, 2026; ERCOT issued provisional classifications on September 3), PUCT Project 58481 (adopted September 18, 2026), and NPRR1337 (the ERCOT Board recommended approval on September 15, 2026). The other dates that have passed, including the PUCT Project 58000 comment deadline of August 11, the PUCT Project 58482 comment deadline of September 4, and the Provisional Controllable Load Resource reliability-model milestone of August 21, were scheduled for those dates and have not been re-checked here. Read them as dates that arrived rather than outcomes that are known.
Methodology
One line per basis item. Every 2026 figure is preliminary telemetry, unofficial until ERCOT settles it. Demand records are ERCOT's integrated system load for the full hour; ERCOT states it does not count instantaneous loads for records. Grid Flexibility analysis means computed from ERCOT-published data.
| Item | Basis, and the limit on it |
|---|---|
| Load | Point-in-time load values are labeled by instrument. The 16.3 GW and 2.85% growth comparisons run a preliminary 2026 telemetry endpoint against settled historical endpoints, so both stay preliminary until July 2026 settles. ERCOT's own August 2023 board report carried a preliminary 85,464 MW for the same record. EIA-930 agrees within about 15 MW daily. The 91,089 MW carried here is reproduced from ERCOT's hourly zonal load archive (91,089.5 MW at hour ending 18:00 CT) and matches ERCOT's all-time records page. Between the August 25 and September 2 captures ERCOT revised the same day to 91,134 MW on its 2026 records page only, leaving its all-time page unchanged; that 45 MW is inside the movement ERCOT's own footnote warns of before settlement, and this article carries the reproducible figure. |
| Growth | The 20,235 MW coincident increase and its zone shares: Grid Flexibility computation on ERCOT's Hourly Load Data Archives. The two growth figures are not interchangeable: 16.3 GW is the change between annual system peaks, 20,235 MW is the change at the June-July coincident peak hour, and that window difference accounts for the whole 3,965 MW gap. Geography proxies the driver mix. The 16.3 GW nets 2026 telemetry against 2019 settlement. Compound rates run between annual peaks on ERCOT's Yearly Peak Demand Records page. |
| Customer type | Three ERCOT series measuring different things. The 15.5% growth is average daily demand; its 3.1 and 3.6 GW endpoints are read from ERCOT's January 2026 System Operations Update. The 2.6 to 5.9 GW energized series is on ERCOT's July 29, 2026 vintage; ERCOT's June 2026 deck carries 3.3 GW at the 2022 point, and two of its three 2026 decks carry 2.6. The firmness split is computed from ERCOT's own hourly-by-category LTLF workbook (each category's annual maximum hour, 2026 differenced against 2031, ERCOT-total columns) rather than read off the report: the report states the taxonomy and the definitions but not the magnitudes. Each category peaks in its own hour, so the tiers sum to 47.6 GW against a 49.3 GW net-peak change; both are given rather than reconciled. An earlier version published 2.1 / 15.8 / 28.8 GW summing to 46.8, which a citation audit could not find in any cached ERCOT source. |
| Interconnection queue | ERCOT's July 29, 2026 Senate Business and Commerce deck, slide 6, labeled “as of June 2026”: about 474 GW cumulative to 2032/2033, roughly 90% data center on a gross-request basis. Its status rows give 284.3 GW with no studies submitted and 135.5 GW under ERCOT review against 5.9 GW energized. Batch Zero eligibility of about 205 GW is slide 10, data as of July 28, 2026. ERCOT's June 2026 Monthly Operational Overview, published July 16, carries 465.5 GW under the same month label. The Senate deck is the later document and uses ERCOT's current category set. Energized load is a sum of each site's own all-time maximum. |
| Dockets | Statuses and dates from PUCT Interchange filing lists, filed rule text, and ERCOT's revision-request pages, checked August 3, 2026, with three rows re-verified on October 1, 2026: Batch Zero against ERCOT's Board item 14 (September 14 to 15, 2026), PUCT Project 58481 against the adoption order (item 218, September 18, 2026), and NPRR1337 against ERCOT's issue page. The reliability-standard schedule is PUCT Project 58777 item 41, filed July 2, 2026, which supersedes earlier staff roadmaps. ERCOT's July 2026 legislative status report carries the DRRS implementation date as to be determined. Where ERCOT states a month or a quarter, this table does the same. PCLR's effective date is the carve-out on NPRR1325 and PGRR145, both of which take effect July 11, 2026 for all sections except those creating PCLR. |
| Temperature | Event-week highs and the records they are measured against both come from NOAA ACIS daily maxima, one archive on both sides of every margin, over each station's full period of record (KDFW from 1974, KIAH 1969, KSAT 1942, KATT 1938, KMAF 1930), so both sides of every margin come from one instrument. ACIS corrected Austin's all-time record from 110 F to 112 F, moving the all-time range from 6-13 F to 7-13 F. An earlier ERA5 reanalysis read is kept as a cross-check; it ran 0.1 to 2.8 F cooler than the stations and widened every margin. |
| Prices | Grid Flexibility query of real-time HB_ hub prices on Central-time days. The cross-year comparison uses equal-length windows placed at the same offsets around each record day, four days before through three days after: July 18-25, 2026 around the July 22 record, and August 6-13, 2023 around the August 10 record. Distributions are unnormalized and descriptive. The $1,000/MWh counts are settlement-point observations at or above that level; the 0.18% is the share of settlement points in the single worst hour, a different denominator from the 41-of-854,438 window share and never mixed with it. The record-day comparison pools every 15-minute HB_ hub price on each of the eight all-time peak days since ERCOT went nodal in December 2010 (six hub series before April 2019, seven after). Those days span three offer caps. PUCT Rule 25.505 held offers at $3,000/MWh through 2011, then stepped the cap to $4,500 (August 2012), $5,000 (June 2013), $7,000 (June 2014), and $9,000 (June 2015); the PUCT lowered it to $5,000 effective January 1, 2022. August 3, 2011 pinned its cap, so its 95th percentile and maximum are the same number, and the UT Austin Bureau of Economic Geology records ERCOT hitting that $3,000 cap for 17 hours that August. The 34x tail range runs between 2016 and 2023, neither of them capped. Medians sit far below every cap in all eight years. ERCOT's Real-Time Co-optimization Plus Batteries design went live on December 5, 2025, so the two windows sit either side of a market-design change and the comparison is not normalized for it. Nodal figures cover roughly 1,114 settlement points, a separate series. For the nodal daily series, each clock hour pools the available settlement-point prices from its 15-minute intervals. The hourly P95 is calculated on that pool, and the daily P95 series takes the highest of those hourly P95s. The median series takes the median of the day's hourly medians. The maximum series takes the highest single settlement-point interval. |
| Carrizo Springs BESS | Three primary records agree: ERCOT's settlement-point mapping (NP4-160-SG), its September 2026 Monthly Outlook for Resource Adequacy (9.9 MW, Dimmit County), and EIA-860M plant 69331. |
| Notices | The July 22, 2026 finding is the absence of any of the four Section 4.2 notice types, plus Weather Watch and EEA, from a continuously covered log. The log is not empty: it carries routine Operational Information entries through the window, including Non-Spin deployments and a DC-tie derate. Issued and in effect are separate fields (sent that day; an earlier multi-day notice spanning it). Sources: ERCOT's archived Operations Messages log before 2011, and its Monthly Operations Report to the Reliability and Operations Subcommittee for 2019 to 2023. August 31, 2000 predates the log and all four notice types. August 3, 2004 is flagged rather than confirmed; excluding it leaves 13 records, 10 same-day. ERCOT's Nodal Operating Guides effective November 1, 2023 set the Energy Emergency Alert triggers at Physical Responsive Capability below 2,300 MW for Level 1 and 1,750 MW for Level 2 (Section 4.5.3.3). Only that vintage is cached, so it fixes the thresholds from that date rather than showing a change at it. |
| Curtailment | max(HSL - Base Point, 0) per resource and SCED interval, 60-Day SCED Disclosure Reports (NP3-965-ER). Online WIND and PVGR only, storage excluded, economic and reliability curtailment combined. Two windows have been computed as separate diagnostics and neither is the event week nor a trend: solar 2.93% and wind 1.24% across July 17-27, 2025, and solar 0.67% and wind 0.77% across May 27 to June 3, 2026. They are not comparable to each other, since SCED ran 96 executions a day in 2025 against 288 to 293 in 2026, and the windows differ in season, length, and fleet. The hourly capability-minus-output series (NP4-737-CD, NP4-732-CD) is headroom rather than curtailment: a median 2.9x and up to 11.2x SCED curtailment on seven overlapping days, with capability dipping below generation in 22.9% of solar hours. |
| Panel heat | Two cached primaries: the -0.41% per degree Celsius utility-scale module coefficient and the 1.30 DC:AC ratio from UL's solar-profile study for ERCOT (Table 4.1 and the site-parameters table), and the ambient-to-cell step from Sandia's Photovoltaic Array Performance Model, SAND2004-3535, which puts cells at 65 to 70 degrees Celsius (149 to 158 F) at 105 F ambient. The Sandia model is a heat-transfer model whose open-rack parameters still apply; the coefficient is the dated input. UL described -0.41% as near-current technology in 2019, so the figure is stated as ERCOT's planning assumption rather than as a property of panels generally. Whether the modules ERCOT is integrating in 2026 carry a different coefficient is not established here: no module datasheet or technology baseline is cached. Stated as a module-level percentage. The penalty is DC-side while ERCOT's metered 33.5 GW is AC, so a fleet megawatt figure would require each plant's DC-to-AC ratio, inverter state, irradiance, wind, and cell temperature, none of which ERCOT publishes. |
| Demand-side products | ERS procurement volumes are not stated here: the range this project holds traces to a consultant presentation it has not cached. ADER's 158.2 MW is qualified Energy capacity (plus 35.4 MW Non-Spin, 49.9 MW ECRS). The ESR record is NP4-765-ER. No fleet size is given for retail-provider battery aggregations: the company figures in circulation (a home count, a deployed-MWh total) trace to press coverage this project has not cached, and our own working files carry two values a factor of five apart. |
| Rooftop solar | EIA's 3,137 and 3,340 MW are small-scale PV net summer capacity (derated AC): under 1 MW, Texas statewide, all sectors, and all mounting types, so wider than rooftop. ERCOT's 3,110 MW is its end-of-2024 fact-sheet estimate, ERCOT area only. The two draw partly on the same net-metering returns. |
| Fuel mix | EIA-930 hourly net generation for ERCO. Its battery values match ERCOT's own EIA-930-ER posting on spot check; storage history begins November 2024. The 5-minute peak-day figures come from ERCOT's dashboard, a separate series. |
max(HSL - Base Point, 0) per resource and SCED interval, 60-Day SCED Disclosure Reports (NP3-965-ER). Online WIND and PVGR only, storage excluded, economic and reliability curtailment combined. Two windows have been computed as separate diagnostics and neither is the event week nor a trend: solar 2.93% and wind 1.24% across July 17-27, 2025, and solar 0.67% and wind 0.77% across May 27 to June 3, 2026. They are not comparable to each other, since SCED ran 96 executions a day in 2025 against 288 to 293 in 2026, and the windows differ in season, length, and fleet. The hourly capability-minus-output series (NP4-737-CD, NP4-732-CD) is headroom rather than curtailment: a median 2.9x and up to 11.2x SCED curtailment on seven overlapping days, with capability dipping below generation in 22.9% of solar hours.