Case Study · PJM Interconnection
July 2026 Heat Wave: Demand Response Rewired PJM's Peak
The hottest day PJM has ever measured should have broken a demand record that had stood for nearly two decades. It didn't. PJM credits demand response, reported at a provisional record scale in a year when its auctions cleared the least demand response in 15 years, with suppressing the observed peak (PJM preliminary figures). Part of that low is a 2025 change in how PJM credits it.
Key takeaways
- PJM estimates July 2 demand would have set an all-time record, 168.2 GW (PJM preliminary).# The observed peak came in at a preliminary 162.6 GW, below the record standing since August 2, 2006. PJM credits demand response with suppressing the observed load.
- PJM reported roughly 6.1 GW of expected load-management reductions for July 2 (preliminary, RTO-wide), a provisional high in its 35-year event log, narrowly edging a September 2013 deployment (6.0 GW across 15 zones).# Winter Storm Elliott (3.8 GW, December 2022) ranks third. For July 3 it reported roughly 5.0 GW more.
- The market bought less of it than in years. For the delivery year in effect on July 2 (2026/2027), PJM's capacity auctions cleared 5.7 GW of demand response, 4.1 percent of the 137,803.1 MW of capacity-resource clearings across those auctions: the smallest cleared total since 2011/2012. That is accredited capacity, which PJM discounts.
- The capacity year in effect during the heat wave (2026/2027) cleared at $329.17/MW-day, at the cap of a new price collar.# A day like July 2 is what the capacity market exists to buy. It pays generation and demand response alike to stand ready for the grid's hardest hours. The run-up was steep: $28.92 for 2024/25, then $269.92 for 2025/26, nearly ten times higher, with the BGE and Dominion zones, constrained in that auction, clearing at their zonal caps ($466.35 and $444.26). PJM's reported cost to load for the 2025/26 and 2026/27 capacity years is roughly $14.7 billion and $16.1 billion, up from $2.2 billion two years before.
PJM's 168.2 GW is a counterfactual estimate of demand absent curtailment; 162.6 GW is metered load. They sit on different measurement bases; the full accounting is in the methodology section.
What happens next, including PJM's 60-day performance evaluation, winter 2026-27, and the next two capacity auctions, is in What to Watch.
The Event
The Record Held
PJM's all-time peak load record, 165.6 GW, has stood since August 2, 2006, nearly two decades.# July 2, 2026 set PJM's highest footprint-average air-temperature reading on record (97 degrees, PJM's own figure). PJM estimates that demand absent any curtailment would have reached 168.2 GW that day, a new all-time record. The meters recorded 162.6 GW instead. PJM credits demand response with suppressing the observed load. PJM reported roughly 6.1 GW of expected load-management reductions on its call, a provisional high in an event log that runs back to 1991.
PJM did this in a delivery year whose auctions had cleared the least demand response in 15 years, at near-record capacity prices, with summer peaks forecast to grow 3.6% a year for the next decade.
Fourteen Days, Beat by Beat
June 25. PJM issues its first Hot Weather Alert for June 29, four days out (PJM emergency postings), a routine notice telling generators and demand resources to get ready for hot-weather operations.
June 29, the warmup. The first hot day. Heat arrives from the west, with Columbus reaching 91 F while the coastal cities hold to the upper 80s. The preliminary hourly peak reaches 144.5 GW (our zone-sum extraction from PJM's hrl_load_prelim feed, sum of PJM's ten load areas). Evening prices move more than load does: the peak median-node price runs about 13 times the June 20-28 evening mean (our calculation; about 18 times against an all-hours baseline).
City temperatures are modeled hourly values (Open-Meteo), the same series the timelapse shading and dials display, not station observations. PJM's 97-degree figure is PJM's own footprint-average measure (PJM Inside Lines, July 10, 2026).
July 1, the escalation. The heat shifts east: Baltimore and Washington reach 97 F, while Columbus hits 95 F. A NERC Energy Emergency Alert 1 takes effect for the RTO (PJM emergency postings), signaling that operating reserves are tightening. The preliminary hourly peak hits 161.9 GW, within 2.2 percent of PJM's restated 2006 record. In the western footprint, AEP (PJM's largest zone by registered demand response) comes within 16 MW of its all-time zone record: 24,918 MW preliminary (our extraction from PJM's preliminary load feed) against the 24,934 MW metered peak from August 2007 (PJM 2008 Load Forecast Report, Table B-1, in PJM's Previous Load Forecast Reports archive). That's six hundredths of one percent on a 25-gigawatt zone. Final metered data could still flip it.
July 2, the peak. The core of the heat sits on the Mid-Atlantic: Washington and Philadelphia reach 102 F, Baltimore 100 F, while the west eases (Columbus 94 F, Pittsburgh 93 F). PJM measures its highest footprint-average air-temperature reading on record, 97 degrees (PJM Inside Lines, July 10, 2026; PJM notes many areas, particularly the Mid-Atlantic, were in the low 100s). Thermometers crest mid-afternoon (2 to 4 p.m.). Load follows at 5 p.m. Every level of PJM's emergency-procedures ladder, the chips on the timelapse's right edge, lights. Pre-emergency load management deploys across 19 zones through the afternoon, 20 counting a later add (PJM operations update, July 2). At 5:20 p.m. ET, PJM declares a Maximum Generation Emergency for its Southern and Mid-Atlantic regions (PJM emergency posting 105314), the capacity-emergency step, scoped to where the stress concentrated. The regional emergency and the week's steepest prices land on the same corridor the heat did, the Mid-Atlantic load pocket (PEPCO, BGE, Delmarva). PJM's reported expected load-management reductions for the day reach approximately 6.1 GW (preliminary, RTO-wide). The observed hourly peak lands at 162.6 GW. The evening's highest RTO-wide price was $1,869/MWh, and the highest-priced zone that hour was PEPCO, the Washington, DC area, at $2,558/MWh. July 2 closes holding three marks: PJM's highest footprint-average air-temperature reading on record, a provisional high in its load-management event log, and an observed peak within 2 percent of the 2006 record.
July 3, the second dispatch. The Mid-Atlantic holds at 100 to 102 F. The heat continues, and PJM reported roughly 5.0 GW more of expected load-management reductions (preliminary). Richmond reaches 100 F as Dominion (the zone at the center of the data-center buildout) sets a provisional all-time zone high of 25.4 GW (our extraction from PJM's preliminary load feed) at 6 p.m. ET. PEPCO posts the event's single highest zonal price the same evening, $2,635/MWh (5 to 6 p.m. ET). Dominion's prior all-time high was set five months earlier, in February 2026. PJM's regional emergency calls applied to Dominion across the event, though day-by-day zone performance isn't separately published. Data Center Alley is breaking its own records in both seasons.
July 4, the holiday lull. The hottest single reading of the entire event, 103 F in Washington (Richmond 101 F), lands on the holiday. Load and prices ease anyway: the day's peak load comes in about 17.5 GW below July 2's. The holiday weekend makes for a useful, if uncontrolled, comparison: hotter temperatures, a calmer grid, a different human schedule. Every emergency chip goes dark.
July 6. The heat breaks. Eleven days after the first alert posting, the event closes with the system intact. PJM's public emergency-message record shows no load-shed notice for the window. The preliminary peak record carries a demand-response asterisk that PJM's September evaluation will resolve.
Why It Worked
What Actually Got Dispatched
For this article, PJM's demand-response programs group into three channels. Load management is the capacity-market workhorse, dispatched through the pre-emergency and emergency steps of PJM's ladder: pre-emergency is the default status, and emergency status is reserved for behind-the-meter generation with environmental operating restrictions (Monitoring Analytics, 2025 State of the Market, Section 6). Resources register to respond within 30, 60, or 120 minutes. Economic demand response is load that offers into the energy market and settles under PJM's energy-market rules, no emergency required. Ancillary-services demand response covers synchronized reserve and regulation, the fastest-responding products. PJM's own taxonomy also includes Price Responsive Demand, which sits outside these three channels. The 6,113 MW PJM reported for July 2 is load-management availability, its expected reductions across load-management lead times and products (PJM Operating Committee update, July 9, 2026), not a total across all channels.
By PJM's own load-management event log, which runs back to 1991, July 2 is a provisional high, on a preliminary count: it edges a 15-zone deployment from September 11, 2013 (6.0 GW of committed capacity) by about 65 MW. That call came on the second of back-to-back September heat days, one of five emergency events PJM declared that year, and it drew on a capacity market that had cleared roughly 10.8 GW of demand response. July 2 pulled a comparable number from a cleared position half that size. Winter Storm Elliott, at 3.8 GW in December 2022, ranks third; the January 2014 polar vortex, at 3.0 GW, fourth. The basis for that 65 MW margin, the 2013 source documents, and why it's a thin margin rather than a blowout are in the methodology section.
Among other US grid operators, we found no larger single event. MISO's response to that same Winter Storm Elliott peaked at about 3.5 GW in any one hour (its widely cited 6.2 GW figure sums three separate hours, not one simultaneous call), and CAISO's September 2022 heat emergency dispatched about 1.3 GW. MISO runs the country's largest registered demand-response fleet, so a bigger MISO event is structurally possible, but we found none documented in the evidence sets we reviewed.
Cleared Demand Response at a 15-Year Low
The demand response PJM leaned on July 2 came out of a capacity auction that had cleared less of it than in any year since 2011/2012. That measures what the market bought and credited, not how much demand response physically exists.
The cleanest long series is cleared demand resource capacity in PJM's annual capacity auction (Monitoring Analytics, 2025 SOM, Table 6-8):
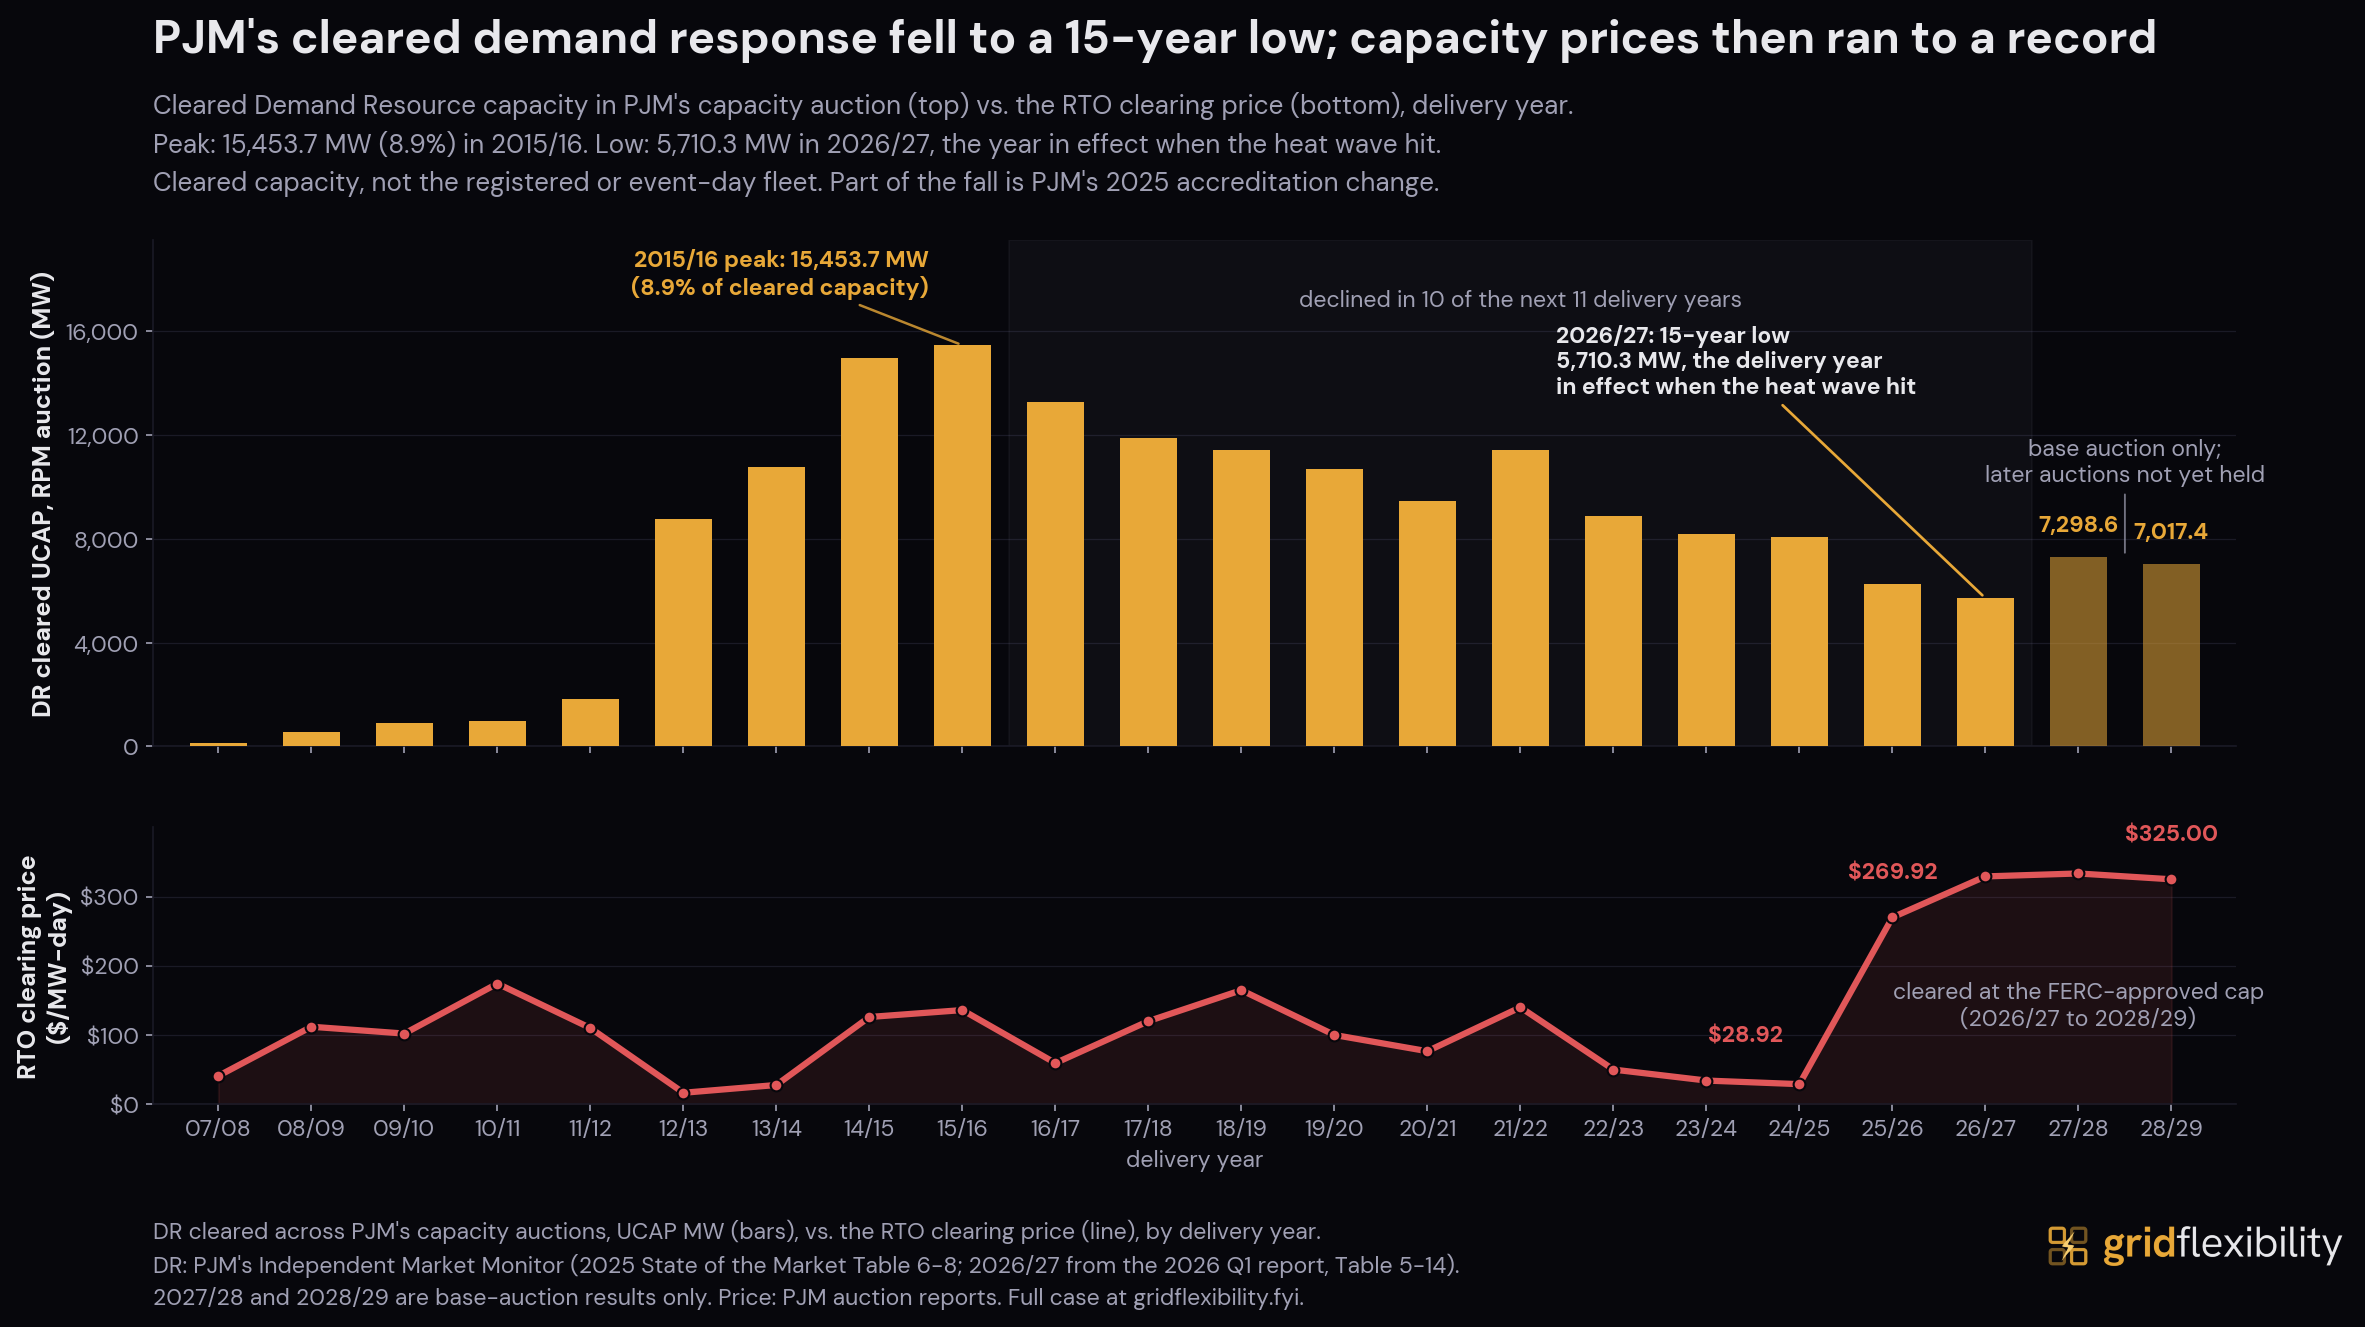
- 2007/2008: 127.6 MW cleared (0.1% of the market). Demand response barely exists yet.
- 2012/2013: 8.7 GW (6.2%), up 4.8x in a single year, the largest jump in this series. Part of it is reclassification: PJM eliminated Interruptible Load for Reliability, which had let sites commit as capacity months ahead instead of clearing in an auction, and replaced its 3,343.3 MW forecast with short-term procurement, so capacity that had sat outside the auction moved into it. That auction also cleared at $16.46/MW-day, the lowest capacity price PJM has ever recorded, not a price spike. PJM's own account credits RPM's launch, a CSP-based aggregation model, and footprint expansion, not a price signal, for the buildout (PJM Demand Response Strategy Paper, 2017, p.19).
- 2015/2016: 15.5 GW (8.9%), the all-time peak. The year before held the peak share, 9.3%.
- Nine of the next ten years: decline. Performance rules tightened after 2015, capacity prices collapsed (as low as $28.92/MW-day for 2024/25), and accreditation reform derated what remained.
- 2025/2026: 6.3 GW (4.5%), down 22.3% in that single year (Monitoring Analytics, 2025 SOM, p.383).
The delivery year actually in effect on July 2, 2026/2027, cleared even less: 5.7 GW, the smallest in fifteen years.# The two auctions run since have turned up, 7.3 GW then 7.0 GW; whether that turn holds is the open question ahead.
Set against 2006, not 2016: in 2006 PJM reported about 3.5 GW of demand-side resources available and 799 MW curtailed, Mid-Atlantic only (2006 State of the Market; LBNL-62754). In July 2026, PJM reported preliminary RTO-wide expected reductions of roughly 6.1 GW on July 2 and 5.0 GW on July 3. The footprints, products, and measurement bases differ. The reported reductions and the cleared-capacity figures sit on different bases as well. Against 2016 the picture holds either way you measure it. The 5.7 GW cleared for 2026/2027 is 37 percent of the 15.5 GW cleared in 2015/2016, and its share of the market is less than half the 8.9 percent peak. Part of that decline is accounting, not attrition: PJM's ELCC-based accreditation now credits demand response at 69 to 76 percent of its registered megawatts (the Accredited UCAP Factor: 76 percent for 2025/2026, 69 for 2026/2027), where the old rules credited it above 100 percent.
The Peak, Rewired
Meeting a peak like this once meant building for it: peaker plants that run only the hardest hours. On July 2, PJM leaned on demand as hard as on its generators, and it was doing more than calling on demand that afternoon. Forced generation outages ran 18.1 to 19.4 GW across July 2 through 4, roughly 1.4 to 1.5 times the 12.8 GW summer average (PJM Inside Lines, July 10, 2026), and PJM ran emergency procedures to maximize available supply at the same time. The peak was met by leaning on both sides of the ledger at once, not by demand response standing in for one specific plant or wire.
None of that erased the strain. Prices ran to extremes, PJM declared a regional Maximum Generation Emergency, Dominion set a provisional all-time zone record while regional demand-response calls were active, and AEP came within 16 MW of a record. PJM did not publish Dominion's zone-level event performance, so the zone's growth cannot be measured against its delivered response. Demand response held the July 2 peak below PJM's counterfactual estimate; it did not eliminate strain, and it did not slow load growth. PJM's official evaluation, expected in September, will be the numbers of record.
What Is Coming
Three Curves, One Grid
Three curves are converging on PJM's grid this decade.
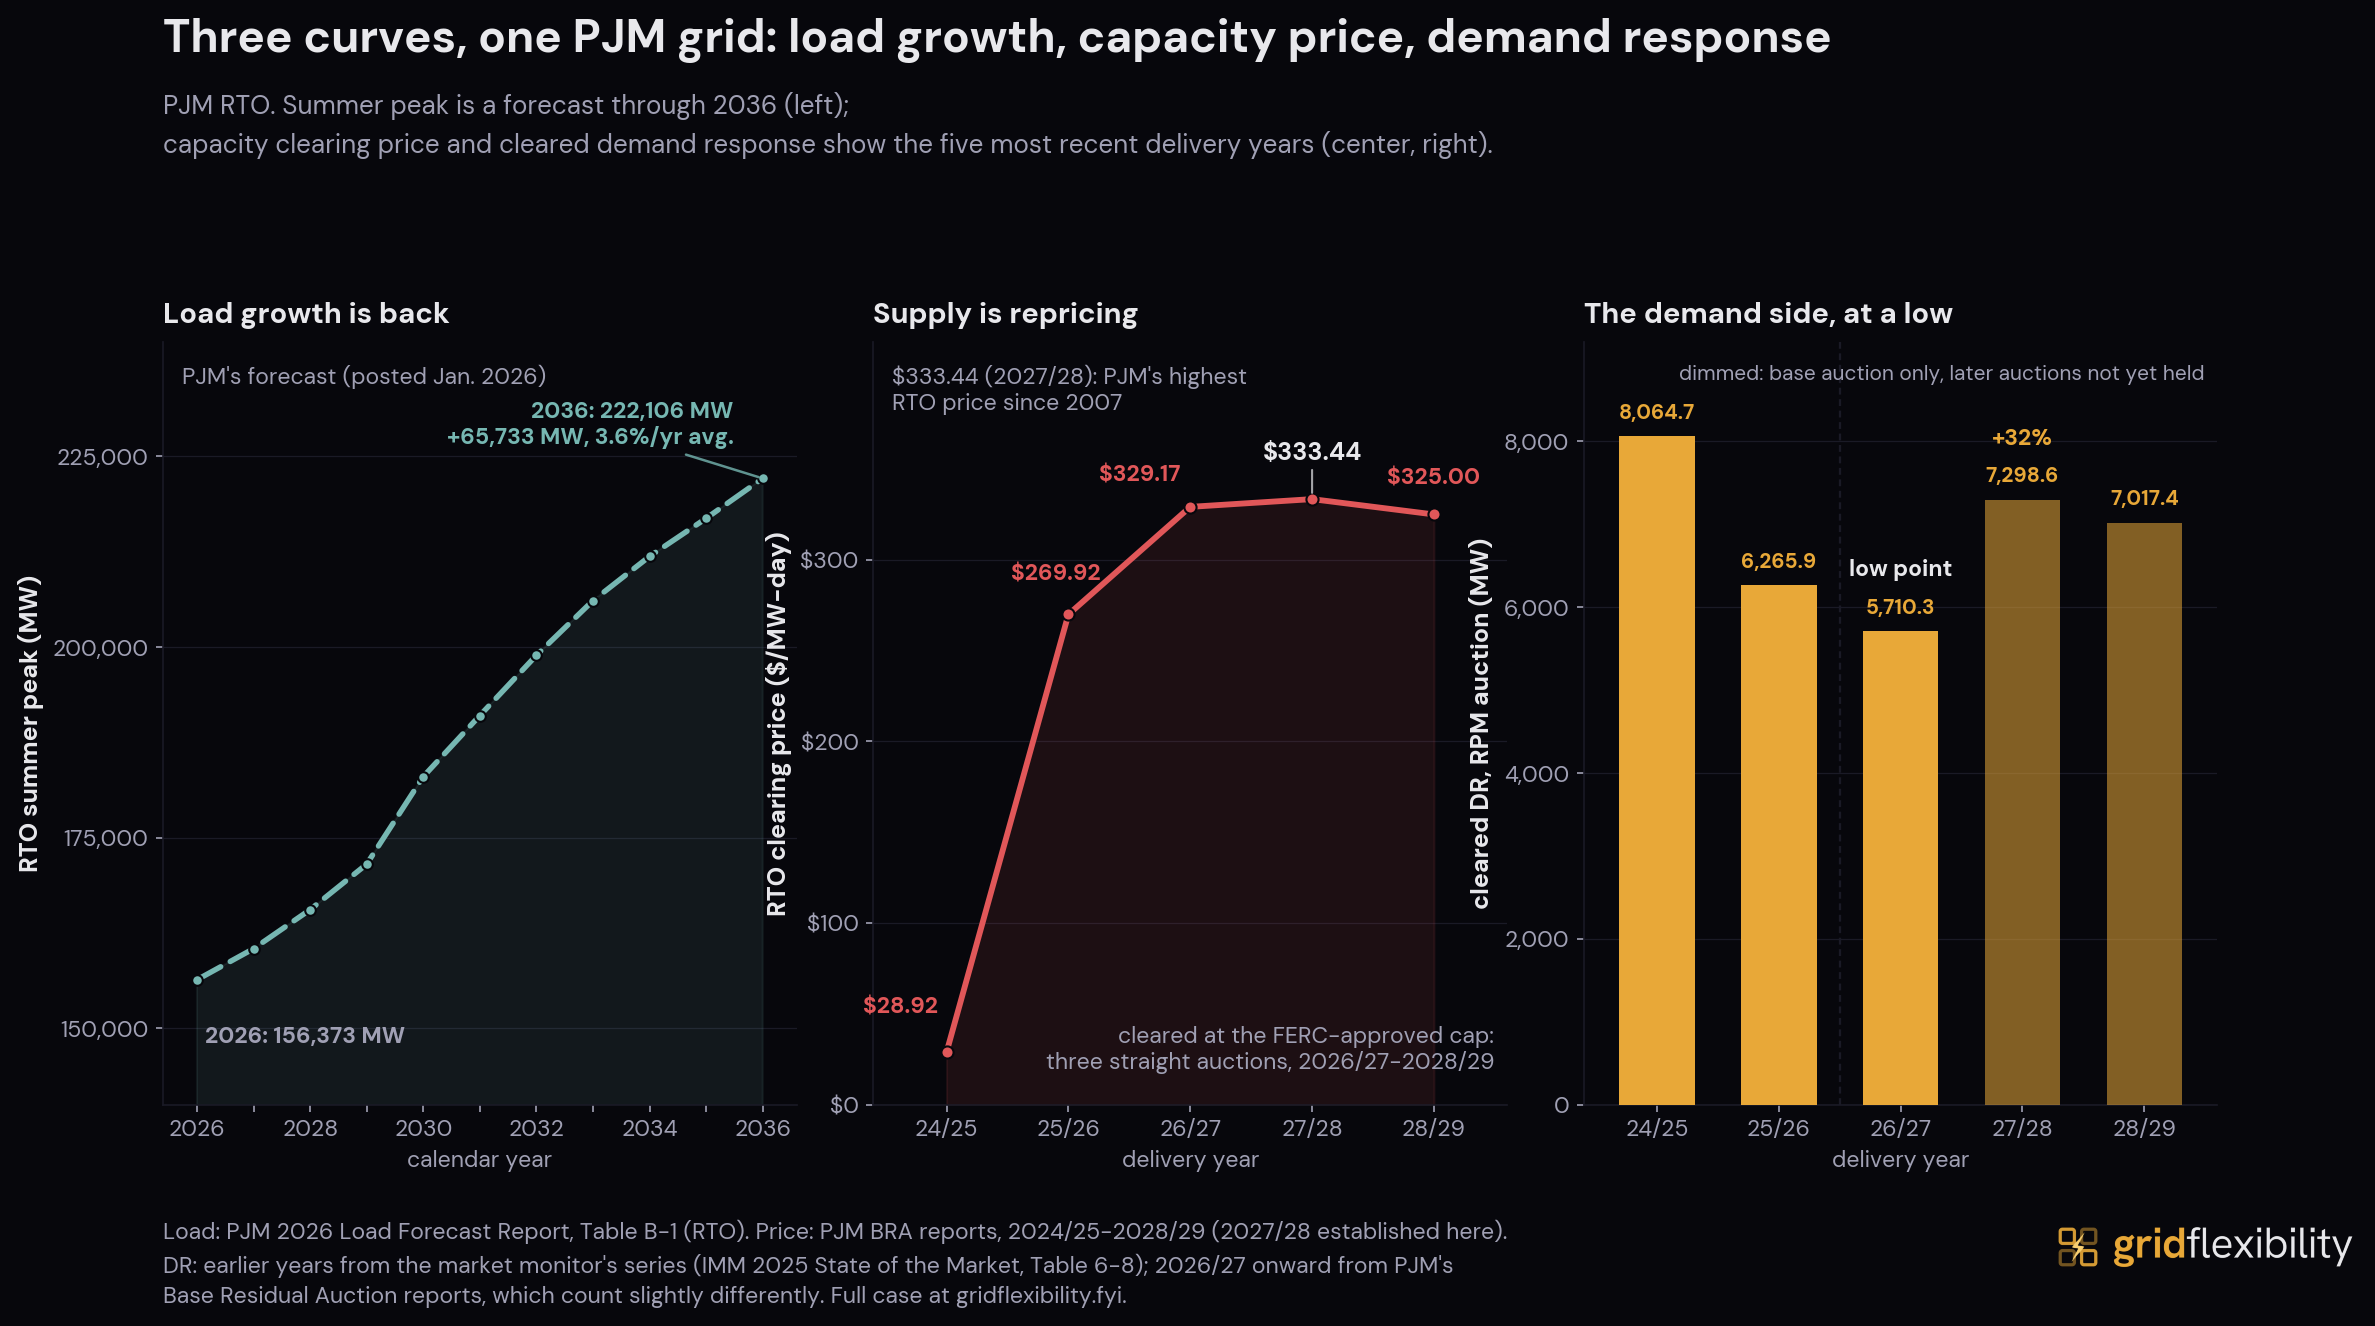
Load growth is back, and it's data centers. PJM's 2026 forecast has summer peaks growing 3.6% a year for the next decade, reaching 222 GW by 2036, a 65.7 GW increase (PJM 2026 Load Forecast Report).# PJM names data-center load as a driver of adjustments in more than eleven zones, including AEP and Dominion, the two zones this event pushed to (or within 16 MW of) records. Winter is projected to grow faster still, 4.0% a year. PJM's net growth is effectively all large-load, as our Data Centers analysis traces in detail.
Supply is repricing. The jump came in a single auction cycle: $28.92/MW-day for 2024/25, then $269.92 for 2025/26, with the BGE and Dominion zones, constrained in that auction, separating to their zonal caps ($466.35 and $444.26), a per-zone maximum on each constrained zone's demand curve that predates and is distinct from the RTO-wide price collar imposed the following year. The 2026/27 auction cleared at $329.17 under that new collar; PJM's own simulation says it would have cleared at $388.57 without the cap (PJM BRA reports, 2025/26 and 2026/27). The 2027/2028 auction cleared at its cap of $333.44, the highest RTO capacity price on record. The 2028/2029 auction cleared July 2026 at $325.00, at the cap of the collar's extension (our 2028/29 auction briefing has the full result). PJM names three drivers: generator retirements, rising demand, and accreditation reform (CRS R48553). PJM reports the cost to load for the 2025/26 and 2026/27 capacity years at roughly $14.7 billion and $16.1 billion, against $2.2 billion two years before.
Cleared demand response is at a multi-year low, its price signal is real, and it is not yet a return to 2016. PJM's capacity price is in record territory, but it isn't the price that built the mid-2010s fleet: the largest growth year in this series cleared at $16.46/MW-day, PJM's cheapest auction on record, and even the priciest year of that buildout, 2015/16, cleared at just $136.00, about half of today's capped price. Cleared demand response fell for three straight delivery years as that price signal rose, from 8.1 GW (2024/25) to 6.3 GW (2025/26) to 5.7 GW (2026/27), because PJM cut demand response's accreditation factor from a reserve-margin add-on to a 76%, then 69%, ELCC derate, a rule change that outweighed the price effect.
The offer side tells a different story. PJM's auctions took in about the same demand response two years running, 8,009.7 MW offered for 2025/2026 and 8,020.1 MW for 2026/2027, and cleared nearly all of it both times. Registered capacity rose 12.7 percent over the same span, to 8.1 GW. What fell was the credit, from 76 percent of nominated megawatts to 69. Both auctions cleared at or near record prices, and the offer volume did not move.
The decline in cleared capacity reversed in the 2027/2028 auction: 7.3 GW, the first increase since 2021/2022. The following year's auction, 2028/2029 (cleared in July 2026 at the same $325/MW-day cap), pulled back slightly to 7.0 GW, still above 2026/2027 but below the year before it. A rule taking effect June 2027 raises PJM's demand response accreditation from 69 to 92 percent (FERC Docket ER25-1525), which PJM expects to support further growth; PJM's own Market Monitor has flagged that the reliability benefit the rule claims isn't yet demonstrated in delivered performance. The 2028/2029 auction has since cleared 7.0 GW, holding most of that increase.
If demand response returned to its own 2015 share of the market (roughly 9%), that would be on the order of 12-13 GW against today's requirement, roughly double the 6.1 GW PJM reported for July 2 (today's accreditation would cap a full physical return nearer 10.5-12 GW). The money is already real regardless: total demand response revenue in PJM more than tripled in 2025, from $153.7 million to $523.6 million, with 88% of it flowing through the capacity-availability channel, not wholesale energy prices (Monitoring Analytics, 2025 SOM).
Our Grid Flexibility Index rates PJM “Untapped.”
What to Watch, with Dates
| When | What to watch |
|---|---|
| Through Sep 2026 | The rest of the cooling season. More heat is plausible. If another event outruns July's, this page updates and the timelapse re-runs on the new window. |
| Mid-Aug 2026 | Large-load show-cause responses. FERC's June 18 orders require PJM and five other grid operators to justify or reform their large-load tariff rules, with responses or reform filings due about 60 days after the orders, a still-open process that could eventually reach curtailability. DOE's 2026 emergency orders separately authorize backup generation at specific large-load sites during declared emergencies; they don't create a general curtailment obligation. See our Dominion case study for the capacity-auction channel. |
| Sep 2026 | The official numbers. PJM's 60-day evaluation turns the preliminary ~6.1 and ~5.0 GW expected-reduction figures, and the 168.2 GW counterfactual estimate, into figures of record. Recent PJM events have settled anywhere from 49 to 70 percent of what was expected; they show the direction and size of past revisions, not a forecast band for July 2026. |
| Fall 2026 | Final metered zone loads. Does AEP's 16 MW near-miss flip into a record? Does Dominion's provisional all-time high hold? |
| Dec 2026 | The 2029/2030 capacity auction. Cleared demand response turned up in the 2027/2028 auction (7.3 GW, after years of decline) and eased slightly in 2028/2029 (7.0 GW). The next auction, scheduled to close in December 2026, is the next test of whether that turn holds once the new 24/7 accreditation raises what each enrolled megawatt is worth. |
| Winter 2026-27 | The second season. Dominion's previous record was set in February. Demand flexibility in PJM is now a two-season requirement, and winter peaks are forecast to grow faster than summer ones. |
| Nov 2027 | Distributed aggregations enroll. PJM's Order 2222 compliance opens aggregator enrollment in November 2027; the full model goes live February 1, 2028, letting home batteries, EVs, and thermostats bid into PJM's capacity, energy, and ancillary-service markets through aggregators. DER capacity offers were already eligible in the 2028/2029 auction. |
Dockets to Watch
The proceedings that will shape PJM demand response and large-load rules, current as of July 2026. Docket numbers, dates, and figures are checked against official FERC, PJM, and DOE text.
| Docket / Order | Date | What it does | Status | Next milestone |
|---|---|---|---|---|
| Capacity-market price collar: ER25-1357-000 and EL25-46-000 (original); ER26-1556-000 (extension) | Apr 21, 2025 (original); Apr 28, 2026 (extension, filed Feb 27, 2026) | Sets a temporary collar on PJM's capacity clearing price. The original covered the 2026/2027 and 2027/2028 delivery years; the extension covers 2028/2029 and 2029/2030. | In effect; both orders FERC-accepted | Governs the 2028/2029 auction below; next test is the 2029/2030 BRA |
| 2028/2029 Base Residual Auction results | Offer window Jun 30 to Jul 7, 2026; results reported Jul 14, 2026 | Cleared at $325.00 per UCAP MW-day RTO-wide, at the collar cap; cleared 7,017.4 MW UCAP of demand response (the BRA-only total, not the 7,364.7 MW figure that adds FRR-committed DR) | Final, published | The 2029/2030 BRA, targeted December 2026 |
| Co-located load: EL25-49-000 et al. (193 FERC 61,217); EL25-49-002 et al. (195 FERC 61,209) | Dec 18, 2025 (order); Jun 18, 2026 (rehearing and compliance) | Directs PJM to write transparent tariff rules and transmission-service options for large loads co-located with generation | Rehearing, clarification, and compliance addressed Jun 18, 2026 | Implementation through PJM compliance docket ER26-1479-000 |
| Large-load Section 206 show-cause: RM26-4-000 (DOE ANOPR); EL26-67-000 (PJM); EL26-68 through EL26-72 (other RTOs/ISOs) | Oct 23, 2025 (DOE ANOPR); Jun 18, 2026 (FERC's six Section 206 orders) | Requires PJM to justify or reform its large-load tariff rules | Open; response window running | Resource-adequacy report due 30 days after the order; show-cause response or tariff reform due 60 days after |
| Demand response 24/7 accreditation: ER25-1525-000 | Filed Mar 6, 2025; accepted May 5, 2025; operative for the 2027/2028 delivery year on Jun 1, 2027 | Makes Demand Resources available 24 hours a day, year-round, and raises PJM's Demand Resource ELCC Class Rating from 69% (2026/2027) to 92% (2027/2028) | Accepted; not yet operative | June 1, 2027 effective date |
| Order No. 2222 DER aggregation: ER22-962 (PJM compliance; rulemaking RM18-9-000) | DER capacity offers eligible in the 2028/2029 BRA (Jun 30 to Jul 7, 2026); full model effective Feb 1, 2028 | Lets aggregations of distributed resources (home batteries, EVs, thermostats) join PJM's capacity, energy, and ancillary-service markets | Compliance accepted; phasing in | Aggregator enrollment opens November 2027; full model live February 1, 2028 |
| DOE Section 202(c) emergency orders: series 202-26-02 through 202-26-33 | Series issued Jan 25 to Jul 3, 2026; event-window pair 202-26-33 and 202-26-33A (Jun 30 and Jul 3, 2026) | Authorizes PJM generation to exceed operating, permit, or fuel limits during emergencies. Five documents authorize backup generation at large-load sites before or during an Energy Emergency Alert 3; they authorize customer backup generation (reduces grid withdrawals), not utility-ordered load curtailment or disconnection | Each order active or expired per its own window | Whether DOE issues further Section 202(c) orders through the rest of summer 2026 |
- Date
- Apr 21, 2025 (original); Apr 28, 2026 (extension, filed Feb 27, 2026)
- What it does
- Sets a temporary collar on PJM's capacity clearing price. The original covered the 2026/2027 and 2027/2028 delivery years; the extension covers 2028/2029 and 2029/2030.
- Status
- In effect; both orders FERC-accepted
- Next milestone
- Governs the 2028/2029 auction below; next test is the 2029/2030 BRA
- Date
- Offer window Jun 30 to Jul 7, 2026; results reported Jul 14, 2026
- What it does
- Cleared at $325.00 per UCAP MW-day RTO-wide, at the collar cap; cleared 7,017.4 MW UCAP of demand response (the BRA-only total, not the 7,364.7 MW figure that adds FRR-committed DR)
- Status
- Final, published
- Next milestone
- The 2029/2030 BRA, targeted December 2026
- Date
- Dec 18, 2025 (order); Jun 18, 2026 (rehearing and compliance)
- What it does
- Directs PJM to write transparent tariff rules and transmission-service options for large loads co-located with generation
- Status
- Rehearing, clarification, and compliance addressed Jun 18, 2026
- Next milestone
- Implementation through PJM compliance docket ER26-1479-000
- Date
- Oct 23, 2025 (DOE ANOPR); Jun 18, 2026 (FERC's six Section 206 orders)
- What it does
- Requires PJM to justify or reform its large-load tariff rules
- Status
- Open; response window running
- Next milestone
- Resource-adequacy report due 30 days after the order; show-cause response or tariff reform due 60 days after
- Date
- Filed Mar 6, 2025; accepted May 5, 2025; operative for the 2027/2028 delivery year on Jun 1, 2027
- What it does
- Makes Demand Resources available 24 hours a day, year-round, and raises PJM's Demand Resource ELCC Class Rating from 69% (2026/2027) to 92% (2027/2028)
- Status
- Accepted; not yet operative
- Next milestone
- June 1, 2027 effective date
- Date
- DER capacity offers eligible in the 2028/2029 BRA (Jun 30 to Jul 7, 2026); full model effective Feb 1, 2028
- What it does
- Lets aggregations of distributed resources (home batteries, EVs, thermostats) join PJM's capacity, energy, and ancillary-service markets
- Status
- Compliance accepted; phasing in
- Next milestone
- Aggregator enrollment opens November 2027; full model live February 1, 2028
- Date
- Series issued Jan 25 to Jul 3, 2026; event-window pair 202-26-33 and 202-26-33A (Jun 30 and Jul 3, 2026)
- What it does
- Authorizes PJM generation to exceed operating, permit, or fuel limits during emergencies. Five documents authorize backup generation at large-load sites before or during an Energy Emergency Alert 3; they authorize customer backup generation (reduces grid withdrawals), not utility-ordered load curtailment or disconnection
- Status
- Each order active or expired per its own window
- Next milestone
- Whether DOE issues further Section 202(c) orders through the rest of summer 2026
Statuses current as of July 2026, checked against official FERC, PJM, and DOE docket text.
What to Do With This
If you regulate or set policy: the demand side just posted a PJM-credited, still-preliminary expected-reduction high in a year when the market cleared less demand response than in any year since 2011/2012. When the official figures land in September, they're citable evidence for valuing flexibility in resource adequacy, for rate designs that reward it, and for interconnection rules that ask new large loads to bring it.
If you run a utility, a VPP, or a curtailment business: the case for summer 2027 enrollment is strong but conditional. Capacity prices are at or near their caps, DR revenue is up 240% in a year, and PJM has put its name behind a proof event. In the 2025/2026 auction, the BGE and Dominion zones cleared at their zonal caps, the highest zonal prices in that auction. Winter readiness is now part of the product.
If you build or operate large loads: high capacity prices create potential enrollment value in those zones, contingent on eligibility, accreditation, clearing, and delivered performance; the prices those terms apply to run to hundreds of dollars per MW-day. Dominion set a provisional record while regional demand-response calls were active. Our own read, not a PJM forecast: interconnection reviews in those zones are likely to start asking what new large loads can turn down.
If you are a household: residential end uses make up 4.9% of PJM's registered load-management portfolio (PJM 2026 DR activity report), a measure of enrollment, not of what performed on July 2 specifically; PJM hasn't published device-level performance data for the event. Most of the money in that portfolio moves through capacity-availability payments instead of wholesale energy prices. Enrolling through a utility or curtailment provider is how a household takes part; our Dominion case study lists the flexibility programs available in the zone at the center of this event. Our Southern California Edison case traces the same enrollment-versus-dispatch gap on the residential side, in California rather than PJM.
Methods and Sources
Basis accounting for figures that could otherwise be misread.
Load bases. PJM reported four July 2 load figures: hourly-integrated (162,569 MW, the “162.6 GW” observed peak), instantaneous (about 162,700 MW, 5-6 p.m. ET, behind PJM's suppression statement), demand-response-adjusted (168,158 MW, the “168.2 GW” counterfactual), and PJM's day-ahead forecast (166,241 MW). They are built independently and do not net: 168,158 minus 162,569 gives 5,589 MW, not the separately reported 6,113 MW.
The 2006 record. PJM's contemporaneous 2006 measurement was 144,644 MW. Restated to today's footprint it is 165,563 MW, the figure this piece uses. A third figure, 166,866 MW, adds back 1.3 GW of curtailed load management (2018 Load Forecast Report, Table F-1).
The 2013 comparison. July 2's 6,113 MW is a preliminary expected reduction; September 11, 2013 committed 6,048 MW. The 65 MW margin compares expected reduction against committed capacity. Matched expected-to-expected, 2013 was 5,698 MW and July leads by 415 MW. PJM's evaluation takes about 60 days; summer 2025's three events settled at 70.0%, 69.9% and 49.3% of expected (2025 SOM, Tables 6-31 to 6-33).
Cross-ISO comparison. Seven operator evidence sets: PJM's own log plus MISO, ERCOT, SPP, CAISO, NYISO and ISO-NE. The metric is the largest single-period reported reduction, not a multi-hour sum. MISO's largest single Winter Storm Elliott hour was 3,520.2 MW; the widely cited 6,198.3 MW sums three hours. CAISO reached about 1,300 MW, NYISO 1,541.3 MW, ISO-NE 625 MW. ERCOT (2,885 MW maximum cleared ERS capability) and SPP (987 MW dispatchable, nameplate) enter as ceiling checks rather than events.
Delivery years and what cleared means. PJM's delivery years run June 1 through May 31. July 2 falls in 2026/2027, which cleared 5,710.3 MW: 5,530.6 MW from the base auction plus 179.7 MW from the Third Incremental Auction, the only one held that year. By delivery year: 8,064.7 MW (2024/2025), 6,265.9 MW (2025/2026), 5,710.3 MW (2026/2027), 7,298.6 MW (2027/2028), 7,017.4 MW (2028/2029). The last two are base-auction results only; their incremental auctions have not been held.
Cleared capacity versus what was dispatched. The 5,710.3 MW is accredited and therefore discounted. The 6.1 GW is PJM's preliminary average expected reduction from dispatched Load Management registrations, which PJM defines independently of committed capacity, and its event report does not split RPM from FRR. On the same undiscounted basis PJM listed 7,260 MW of active Load Management registrations for June 2026.
What the 15-year comparison measures. Before 2012/2013, PJM treated Interruptible Load for Reliability as a separate capacity category rather than RPM-cleared demand response. The 15-year comparison is a history of RPM-cleared UCAP, not a like-for-like history of total registered or callable demand-side capacity. Marginal ELCC accreditation begins in 2025/2026, so only two completed delivery years sit on that method. The offer comparison behind the credit finding is a mechanical comparison of two auctions; it does not show what would have been offered or cleared under one common rule.
Price basis. The $1,869/MWh figure (July 2, 6-7 p.m. ET) is the hourly average of PJM's RTO aggregate series in the five-minute real-time feed; a zone-level series gives $1,894.33 and the all-node median $1,641.18. The “13 times” multiple divides June 29's peak median-node price ($574.15/MWh) by the June 20-28 evening mean ($42.98/MWh), both evening-restricted; an all-hours denominator gives about 18x.
Zone comparisons. Hourly loads cited throughout are Grid Flexibility's zone-sum extraction of PJM's preliminary feed for June 20 to July 7, 2026, not a single PJM-published figure. AEP's 24,918 MW (July 1) fell 16 MW short of its 24,934 MW August 2007 peak (2008 Load Forecast Report, Table B-1). Dominion's 25,384 MW (July 3) topped its prior 25,168 MW (February 9, 2026) by 216 MW, a provisional record. Each respects its zone's integration date (AEP 2004, Dominion 2005).
Cost to load. The $14.7 billion and $16.1 billion figures are cleared megawatts times clearing price. Hedged and bilateral supply change what load ultimately pays.
Map geometry. The colored dots are the analysis: each is a PJM pricing node at its own price, congestion included. The warm lines are annotation, marking which monitored element dispatch was holding. PJM withholds facility coordinates as critical energy infrastructure information, so corridor geometry comes from the HIFLD transmission layer and from OpenStreetMap where it supplies a routed path HIFLD gives only as endpoints. Both are route-correlated approximations, which is why the legend says “approx.”, and no share of congestion is claimed from them. Line geometry is © OpenStreetMap contributors, available under the Open Database License 1.0. That geometry in machine-readable form, with the constraint-match table and method behind it, is available from corey@gridflexibility.fyi, satisfying ODbL Section 4.6.
Preliminary data. Every 2026 event figure here is preliminary, subject to revision when PJM's official evaluation posts around September 2026. Quantitative claims are checked against cached, checksummed primary sources or disclosed calculations, and the claim register records each mapping.