Figure
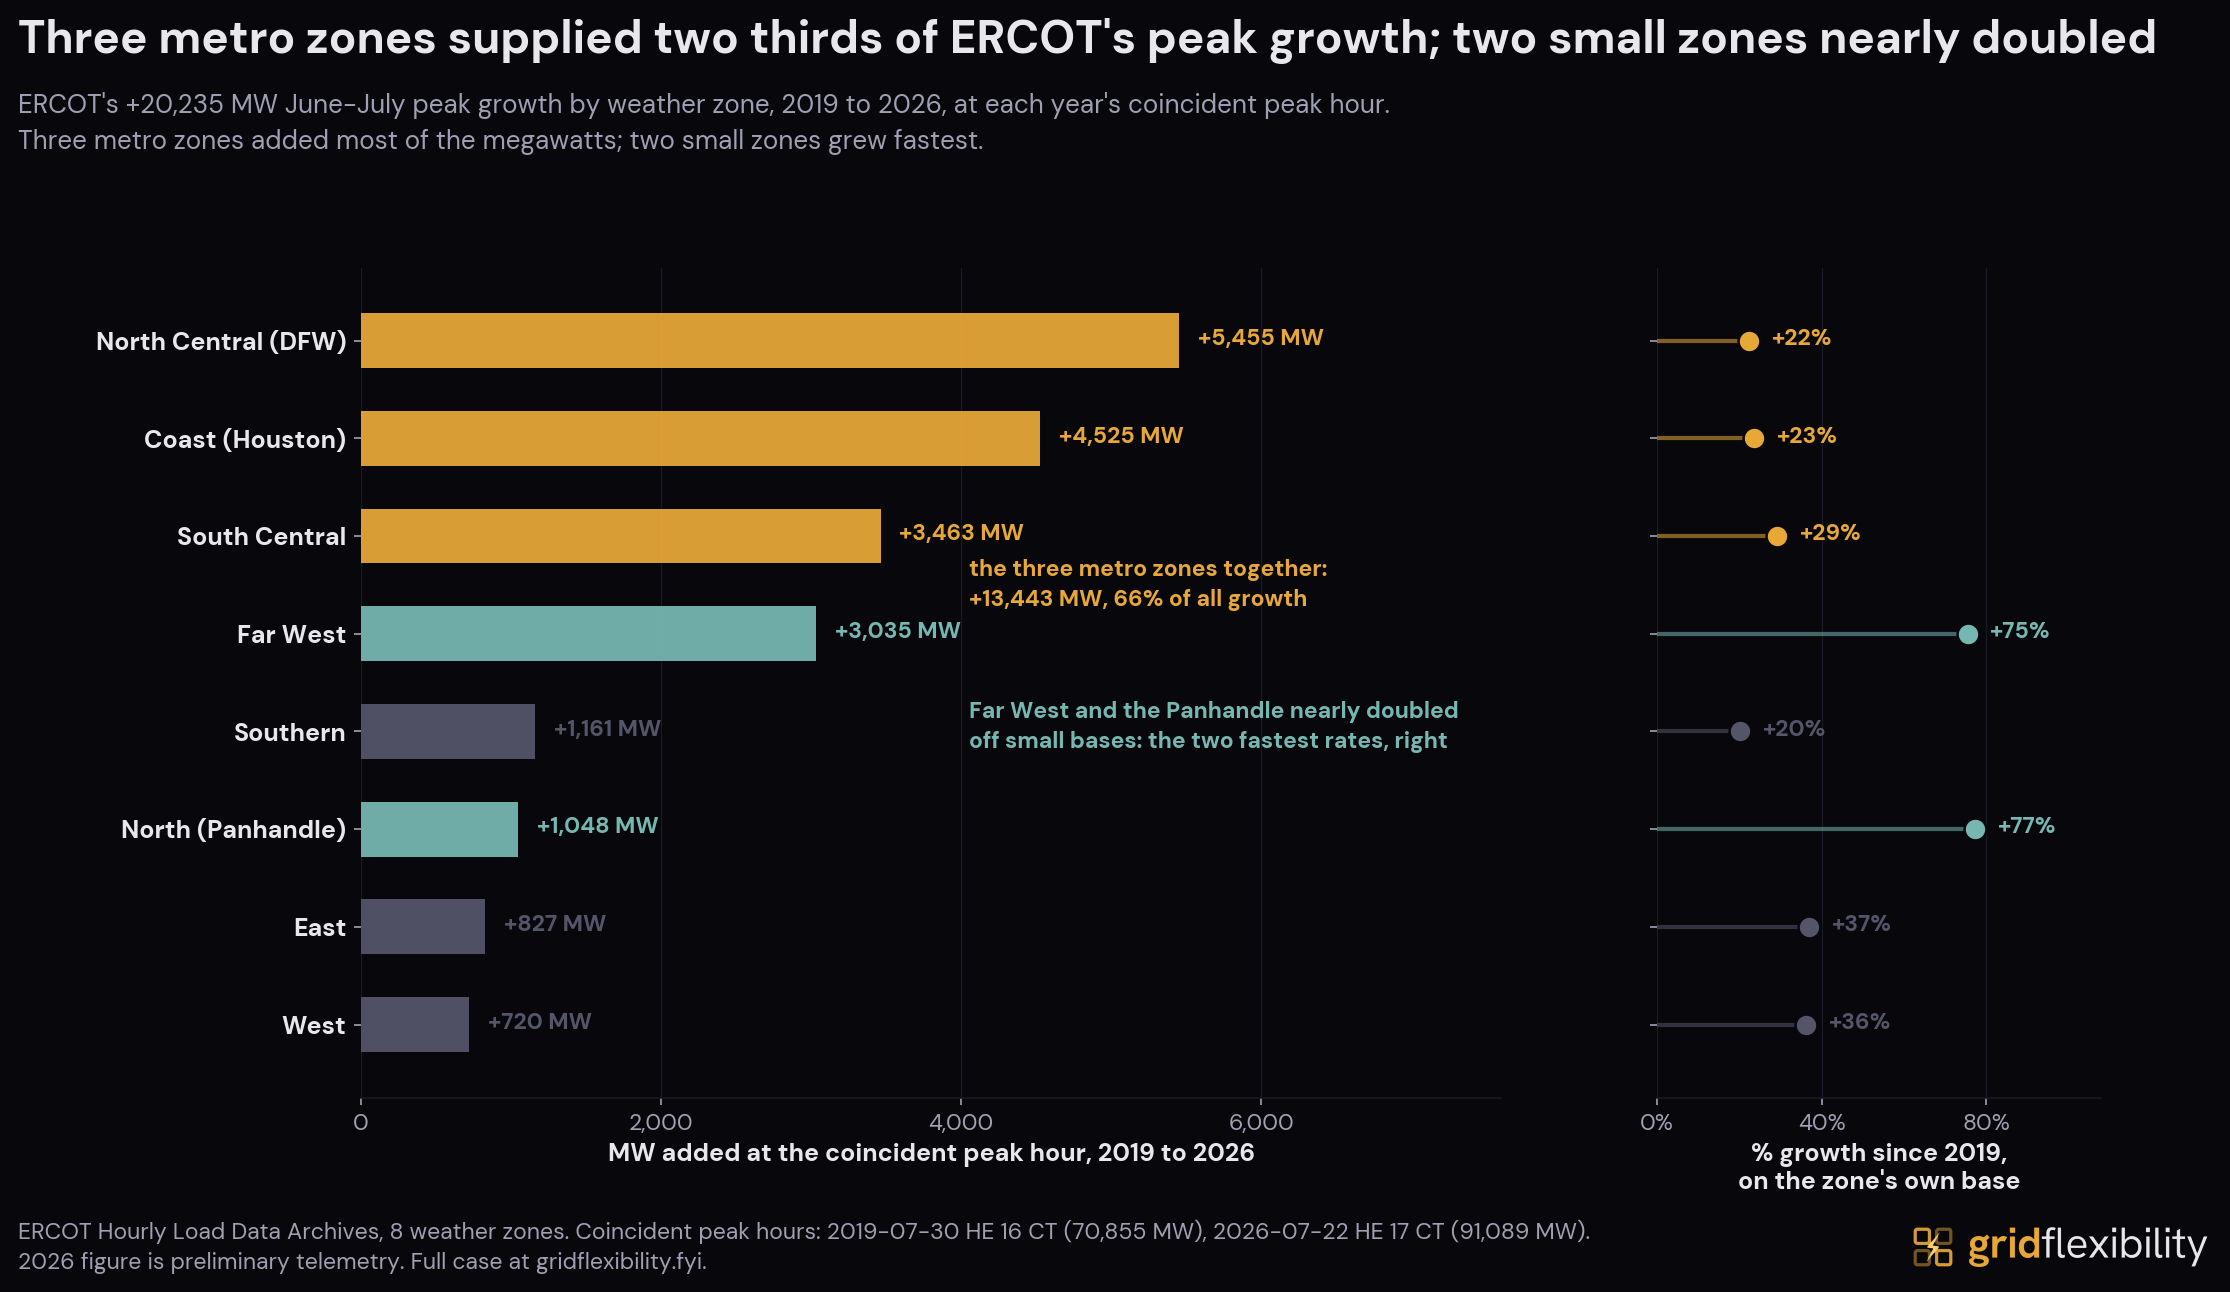
Three metro zones supplied about two thirds of ERCOT's roughly 20,235 MW of coincident peak growth since 2019, while two small zones nearly doubled.
This figure is from the ERCOT July 2026 heat-wave case study, a primary-source reconstruction of an all-time demand record crossed on a week without record heat, and what the public record does and does not show about it.
Cite this figure
Corey Balgeman, "Where ERCOT's peak growth came from, by weather zone, 2019 to 2026," Grid Flexibility, 2026. https://gridflexibility.fyi/case-studies/ercot-heat-wave-july-2026/figures/ercot-growth-decomposition
Licensed CC BY 4.0: free to republish with attribution. License details.
New analyses are announced by email.
Last updated: 2026-08-05.