Grid flexibility: getting more from the grid we already have
Peak demand as a multiple of average demand in 2025. A higher multiple means a sharper peak. Hover over a curve or select a grid below to highlight its curve and its average.
The dashed line is the selected grid’s average demand. The gap between it and the top of the chart is how far the peak runs above the average. The shaded area is how far each hour’s demand fell below that grid’s peak. Source: EIA Form 930 hourly demand.
Grid flexibility means shifting the timing of power use, storage, and generation to match what the grid needs, away from the hours when it is strained and toward the hours when power is in surplus. A grid is strained when demand runs close to what it can deliver, and in surplus when it has more power than it can use or store. The grid must balance supply and demand every moment. For decades, power plants did most of that work by ramping up and down to follow demand. Now demand is rising while the plants that balanced the grid are retiring. The opportunity exists for new forms of flexibility, many of them on the demand side.
Every grid is planned to meet its forecast peak demand in the highest hours of the year, plus a reserve for outages and surprises. Across the seven US regional grids, the 2025 peak ran 1.5 to 2 times the average demand, and those hours set much of the cost of power. Shifting demand out of the peak makes better use of the wires and plants already built, and absorbing surplus uses power that would otherwise go to waste.
What grid flexibility is
Any resource that can change when it produces, uses, or stores power adds flexibility. When it comes from customers it is also called demand flexibility, flexible demand, or load flexibility. The main forms:
- Flexible generation: power plants that ramp output up and down to follow demand. The longest-standing source of grid flexibility.
- Demand response: customers or their devices cut or shift demand when the grid is strained and add it when power is in surplus, usually for a payment or a lower rate.
- Time-varying rates: prices that change with the time of day, from time-of-use rates with two or three daily periods to hourly and real-time prices, so shifting demand saves money.
- Storage: batteries that charge when power is plentiful and discharge in the strained hours.
- Virtual power plants: many small resources (thermostats, batteries, EV chargers) dispatched together like one plant.
- Flexible large loads: data centers and industrial sites that can pause or shift load.
Act I
Reliable flexibility is not scaling with grid stress.
The dispatchable fleet that kept the grid balanced for decades is retiring. Most of the replacement being built is solar and batteries.
Planned dispatchable retirements, 2026-2040
Coal, gas, oil, and nuclear plants scheduled to retire over the next 15 years. 47 GW of that by 2030, with most concentrated in 2026-2028.
Retirement timing varies by region. Some plants may delay.
Planned retirements by year (GW)
Not all replacement capacity is equal. A 100 MW solar farm does not replace a 100 MW gas plant for reliability, because the sun is not always shining. Adjusted for what each technology can deliver during peak demand, 1.1 GW of reliable replacement is under construction or built and awaiting operation for every 1 GW of reliable capacity set to retire from September 2026 through 2030. Solar and batteries make up 69% of that replacement. Most of it (86%) is due online by the end of 2027.
For every 1 GW of reliable capacity retiring by 2030
Reliable capacity = nameplate adjusted by Effective Load Carrying Capability (ELCC), the standard measure of how much a resource delivers during peak demand (NERC, 2025). Per NREL (2024) and ISO filings: coal 85-95%, gas CC 76-93%, solar 8-30%, wind 5-41%, batteries (4h) 50-95%. Retirement base: 47 GW nameplate = 42.6 GW reliable (~90% thermal ELCC). All three ratios above use this denominator. Of the 46.1 GW, 8.8 GW is built and awaiting commercial operation. After 2027, 6.5 GW is due, against 25.7 GW of reliable retirements in 2028 through 2030. Plants that start construction later are not yet in this count. Each technology uses one flat accreditation value.
That ratio captures whether each resource is available when the grid needs it most. It does not show how fast the grid has to swing from surplus to scarcity as solar drops at sunset. In California, where solar generated more than a quarter of all electricity in 2025, grid operators curtailed 3.5 TWh of solar generation that the grid could not absorb. On demanding afternoons, as that solar output fell at sunset, the same grid required more than 14.7 GW of fast-ramping dispatchable power within three hours. That ramp is what retiring gas plants have historically provided. Markets following California's solar adoption curve face similar structural pressures, though timing and magnitude vary by region.
3.5 TWh curtailed: CAISO Production and Curtailments Data, 2025 (solar only). 14.7 GW ramp: 90th percentile of daily maximum 3-hour net load ramp (EIA Form 930 + CAISO load, 2025). Solar share: 26.7% of CAISO generation, EIA Form 930.
Even the 2,061 GW sitting in the interconnection queue face steep odds. Nationwide, only 13% of queued capacity since 2000 has reached commercial operation, and those that do take a median of 5.1 years.
LBNL Queued Up 2026|EOY 2025Backward-looking cohort: projects submitted 2000-2020, measured at EOY 2025. 10% of capacity still active in queue. 7 ISOs + 50 non-ISO utilities (~97% of US capacity). Source: LBNL Queued Up 2026.
The strongest sustained growth since the early 2000s, per the EIA Short-Term Energy Outlook. US consumption plateaued from 2007 to 2019 (just 0.1%/year average), but that era is over.
Trend from EIA Retail Sales (Forms 826/861, actual metered sales). Forecast from EIA STEO (March 2025).
Three sectors are driving this reversal, each representing potential flexible load if paired with smart controls:
Electrification. US EV sales growing ~10% year-over-year; heat pump installations up 14% in 2024. Both add flexible load if managed well.
Manufacturing reshoring. Semiconductor fabs and battery plants (CHIPS Act, IRA) driving industrial load growth of 2-3% annually through 2026.
Large industrial loads are driving an estimated 166 GW of US peak-load growth in utility forecasts for 2025-2030. Data centers lead at ~55% (~90 GW), but Grid Strategies cautions that utility forecasts may overstate data-center growth by about 40%, with independent estimates of roughly 60-65 GW against the utilities' 90 GW. The demand surge is broader, and not every market is affected the same way.
National total: Grid Strategies (2025). Regional: PJM 2026 Load Forecast, ERCOT Adjusted LTLF, MISO 2026 LTLF, SPP 2025 ITP, ISO-NE 2026 Large Load Forecast, NYISO 2026 Gold Book, CEC (California). Bars itemize each ISO's total net peak growth (2026-2031) by driver, with large load split by type; reducers (energy efficiency, behind-the-meter solar) extend left of zero. The national 166 GW above is Grid Strategies' 2025-2030 figure, a different vintage and window than these 2026-2031 regional bars. See the data-centers page for the full breakdown and per-bar sources. Where that load concentrates shapes where flexibility is most needed.
Act II
The grid's most expensive hours are predictable. The dispatchable resources that historically fill them are retiring.
The supply gap already shows up in prices. Most consumers pay a flat per-kWh rate and never see wholesale swings directly, but when grid operators must procure power at scarcity prices to keep the lights on, that cost does not disappear. It flows into capacity charges, rate adjustments, and municipal energy budgets. For a city running on a cost-of-service contract, one bad week in February can shift the annual budget by millions.
How extreme the price signal gets
ERCOT 2025 RTM price peak-to-average
On April 7, 2025 at 6:45 AM CDT, spring maintenance had taken 15,800 MW of ERCOT generation offline. Wind was producing 4.5 GW against a typical 17.5 GW. The Houston area load zone hit $3,860/MWh in a 15-minute settlement interval. S&P Global reported the Houston Hub at $3,777/MWh by HE7. Solar came online an hour later and prices crashed to $49/MWh. On May 16, during a period of extreme heat (ERCOT Monthly Overview, May 13-18), 15-minute settlement prices crossed $2,400/MWh system-wide at 7:45 PM CDT as the evening ramp outpaced falling solar output. For that hour the ERCOT hub price averaged 49 times its annual mean.
April 7: S&P Global Commodity Insights reported Houston Hub at $3,777/MWh at HE7, 15,791 MW of outages (10,260 MW forced). Our data: LZ_HOUSTON $3,860/MWh at 6:45 AM CDT (15-min RTM). Amperon analysis: 5-min LMPs >$4,000 at 6:50 AM, net demand 41.1 GW, wind 4.5 GW vs 17.5 GW typical. May 16: $1,589/MWh hourly peak / $32.3/MWh annual mean = 49x on the ERCOT hub average (HB_BUSAVG), hour beginning 7 PM CDT (our data). 15-min cross-zone peak $2,411/MWh at 7:45 PM CDT. ERCOT Monthly Operational Overview (May 2025) documents extreme hot weather May 13-18. Tyba Energy case study confirms peak 'just under $4K/MWh' at 7:45 PM.
April 7 sources: S&P Global Commodity Insights (same-day, paywalled), Amperon blog (free, detailed operational data). May 16 sources: ERCOT Monthly Operational Overview May 2025 (weather context), Tyba Energy H1 2025 case study (price detail). Verify all prices: ERCOT NP6-785-ER (ercot.com/mp/data-products).
Most of the year, wholesale electricity trades near its average price. The cost problem is concentrated in the hours when it does not: hot summer evenings, cold winter mornings, unexpected outages. A flexible resource that responds only during those hours captures the same value that justifies keeping an entire gas peaker plant on standby year-round. The curve below shows how that cost accumulates across each market.
Where is the above-normal cost concentrated?
Each line shows one wholesale market. The faster it rises, the more concentrated the cost problem is in that market. 2025 real-time market, weighted by hourly demand. Above-normal cost per hour = demand × max(price − annual average price, 0). Only hours priced above the annual average are included.
In MISO, 24hours drive a quarter of the year's above-normal wholesale cost. In CAISO, it takes 302. That gap is not random. It reflects how each market's supply mix shapes the concentration of expensive hours.
CAISO's flatter curve reflects a market where the cost problem is spread across more hours rather than concentrated in a few. Why that happened is the subject of the next section.
Above-normal cost = hourly demand × max(price − annual average price, 0). Hours priced below average are excluded. MISO price: simple average of all 8 trading hubs (no system-level LMP exists). Other ISOs: load-weighted zonal average. 2025 RTM.
“Gas sets the price”
During tight supply hours, the last available resource sets the wholesale price for everyone. That resource has historically been a natural gas peaker plant, with all-in costs between $149 and $251 per MWh, far above average market rates. Those plants survive economically only by clearing the market during scarcity windows: the roughly 100 to 400 hours per year when demand approaches the edge of available supply. As that fleet retires without firm replacements, the marginal-price role shifts to whatever responds fastest: today, increasingly battery storage bidding at the scarcity cap, and in the next decade, demand that was never needed in the first place.
Gas peaker all-in cost range (levelized cost of energy): Lazard LCOE v18.0 (June 2025).
Levelized cost vs ERCOT average wholesale price ($/MWh)
LCOE (levelized cost of energy) is the lifetime cost of generating one MWh from a new power plant, including construction, fuel, operations, and financing. It is the standard way to compare energy technologies.
Solar utility LCOE has dropped below the long-run cost of building new gas peaking capacity. Yet average wholesale prices have not followed. Gas peakers do not need to win average hours. They earn their return during a few hundred hours each year, often when solar cannot respond: dark winter mornings, overcast summer evenings, still nights. Cheap average-hour generation cannot displace a resource that exists to serve hours it cannot reach. Pairing solar with four-hour storage can shift some midday generation into evening hours. Lazard estimates 2025 LCOE midpoints of $91/MWh for solar plus storage and $200/MWh for gas peaking (up from $169 in 2024).
Solar LCOE, gas peaker, solar + storage: Lazard LCOE+ Analysis, June 2025 (utility-scale, unsubsidized, average of the high and low LCOE for each edition; solar and gas peaker from the historical comparison on p. 14, with no 2022 edition; solar + storage from each of the 2023, 2024, and 2025 editions, the first to print it). ERCOT wholesale: annual mean RTM LMP. Shaded band: mean ± 1 std dev.
The other edge: when supply overshoots
The chart above isolates the expensive hours. This section shows the reverse side of the same market shape: low-price solar hours that create charging opportunity and steep evening ramps.
That ramp at sunset has a mirror image. In solar-heavy markets, mid-day oversupply pushes wholesale prices toward zero. Some months go negative. The result is a price shape with two distinct windows: an oversupply trough at midday and a scarcity peak in the evening. Both are predictable. Both show up clearly in the seasonal data.
Average CAISO wholesale price by hour of day, 2016-2025. Each line is one year. In 2016, the daily price curve was nearly flat. By 2025, solar oversupply carved a deep midday trough while the evening ramp created a sharp peak. 2022-2023 price levels were partly elevated by the California gas crisis (SoCal Citygate hit $28/MMBtu in January 2023, roughly 10x the national benchmark). Battery storage (15+ GW by 2025) is compressing both edges: in the first five months of 2025, the solar curtailment rate fell 12% even as solar output grew 18%. Toggle to Spring (Mar-May) below the chart to see the effect at its most extreme, matching CAISO's original 2013 framing.
CAISO RTM, load-zone trade hubs, local time (Pacific). The “duck curve” was first presented by CAISO in 2013; the linked fact sheet is a later update. Their original chart showed net load (demand minus renewables) rather than price. Curtailment rate: CAISO Monthly Renewables Performance Report.
The seasonal detail makes the pattern sharper. Each cell below is the average wholesale price for a given month and hour of day across every day of 2025. CAISO shows both edges: blue cells in spring afternoons where solar oversupply pushed prices below zero, warmer cells in summer evenings where the ramp demand peaks. Switch to ERCOT for summer evening heat waves, or ISO-NE for winter morning fuel constraints. The specific shape varies by grid. The core pattern holds: value concentrates in predictable windows, not random hours.
Average 2025 RTM LMP by hour and month. Yellow indicates higher prices; blue indicates prices below zero.
All ISOs use load-weighted average (SUM(lmp × load) / SUM(load)). Computed from each ISO's published real-time zone and hub prices and hourly zonal load. CAISO: NP15/SP15/ZP26 mapped to PGE/SCE/SDGE load zones by utility territory. MISO: hubs mapped to Load Resource Zones (LRZ1–LRZ8_9_10); LRZ2_7 excluded. PJM: 5 non-overlapping hubs (DOMINION, CHICAGO, NEW_JERSEY, EASTERN, WESTERN) mapped to utility load zones; gen-only nodes excluded. ERCOT: HB_BUSAVG (ERCOT's own generation-weighted system average; EIA load zone names don't align with settlement points). NYISO excludes external interface zones. Local time. Weekday and weekend averaged together.
Grid stress events, market by market
Midwest + South (MISO), 2024-2025. In August 2024, the grid serving 15 states from Minnesota to Louisiana hit 122 GW of demand, approaching emergency operating thresholds. In May 2025, the Department of Energy issued emergency orders to delay coal plant retirements as MISO reserve margins fell toward a critical threshold. In 2025, MISO had the most concentrated above-normal wholesale cost of any US grid: just 24 hours to reach a quarter of the annual total.
The NERC assessment is a pre-season forecast, not a post-event source for the realized August 2024 peak. The 122 GW figure is from MISO's own operational records. MISO 2025 scarcity concentration: 24 hours to reach 25% of annual above-normal wholesale cost. Formula: load x max(price - annual avg, 0), ranked descending. MISO price: 8-hub simple average (no system LMP exists). Source: MISO's published hub prices and zonal load.
Mid-Atlantic + Midwest (PJM), December 2022. Winter Storm Elliott knocked 90,500 MW of generation offline across the Eastern Interconnection, with PJM most severely affected among all regions. Natural gas production from Appalachian shale dropped 23-54% as wellheads froze. FERC and NERC issued 167 pages of recommendations. The same gas-electric interdependency remains.
Had temperatures not warmed on Christmas Day, gas service to New York City would likely have been disrupted, per the FERC-NERC report.
New York (NYISO), 2025. The average wholesale electricity price rose 69% year-over-year, from $37/MWh to $63/MWh. Natural gas prices exceeded $10/MMBtu on 55 days, five times more than in 2024. Since 2019, 4,315 MW of generation capacity has retired while only 2,274 MW was added. The supply margin is tightening.
2025 price figures are from our database. The Potomac Economics 2024 SOM covers through end of 2024; it does not directly report 2025 prices. NYISO 2025 scarcity concentration: 29 hours to reach 25% of annual above-normal wholesale cost.
New England (ISO-NE): 55% natural gas generation, but during extreme cold events gas deliveries to generators can fall well short of peak demand as heating and power generation compete for the same limited pipeline capacity. The constraint is structural: additional pipeline capacity has not been permitted. ISO-NE carries the highest average wholesale prices of any US grid: $66/MWh in 2025.
ISO-NE 2025 scarcity concentration: 168 hours to reach 25% of annual above-normal wholesale cost. Structural pipeline risk persists regardless of concentration level.
California (CAISO) managed two weeks of triple-digit heat in July 2024 with no Flex Alerts and no emergency orders. Of all major US grids, CAISO had the least concentrated above-normal wholesale cost in 2025: 302 hours to reach a quarter of the annual total, compared to 24 in MISO. Sustained investment in storage, demand response, and renewable integration is spreading the cost problem across more hours. Solar curtailment is rising. The challenge shifted, not disappeared.
CAISO 2025 scarcity concentration: 302 hours to reach 25% of annual above-normal wholesale cost. Formula: load x max(price - annual avg, 0), ranked descending. Load-weighted price using NP15/PGE, SP15/SCE, ZP26/SDGE zone mapping. Source: CAISO's published real-time zone prices and zonal load (CAISO OASIS: oasis.caiso.com).
Texas (ERCOT), April 7, 2025. Spring maintenance had thinned the dispatchable fleet. Wind was running well below average (4.5 GW vs 17.5 GW typical). At 6:45 AM CDT, still dark, the Houston area load zone hit $3,860 per MWh in a 15-minute settlement interval. The ERCOT hub price averaged $1,484 for that hour. One ordinary spring morning. ERCOT's price data shows these scarcity patterns clearly.
$3,860/MWh is a 15-minute RTM LMP for LZ_HOUSTON in our database. Amperon reported 5-min RT LMPs over $4,000/MWh at 6:50 AM; their figure and our 15-min average are consistent. Net demand at HE6 was 41.1 GW with 36.6 GW of generation outages. Verify: ERCOT NP6-785-ER (ercot.com/mp/data-products). ERCOT 2025 scarcity concentration: 72 hours to reach 25% of annual above-normal wholesale cost.
These hours are predictable. Seasonal patterns, demand profiles, and weather history identify them weeks ahead. A resource that responds only during those hours captures the same value that keeps a gas peaker viable. That is the flexibility opportunity: not 24/7 availability, only when the signal fires.
Act III
Flexibility is already reshaping the grid. The evidence is in the price signal.
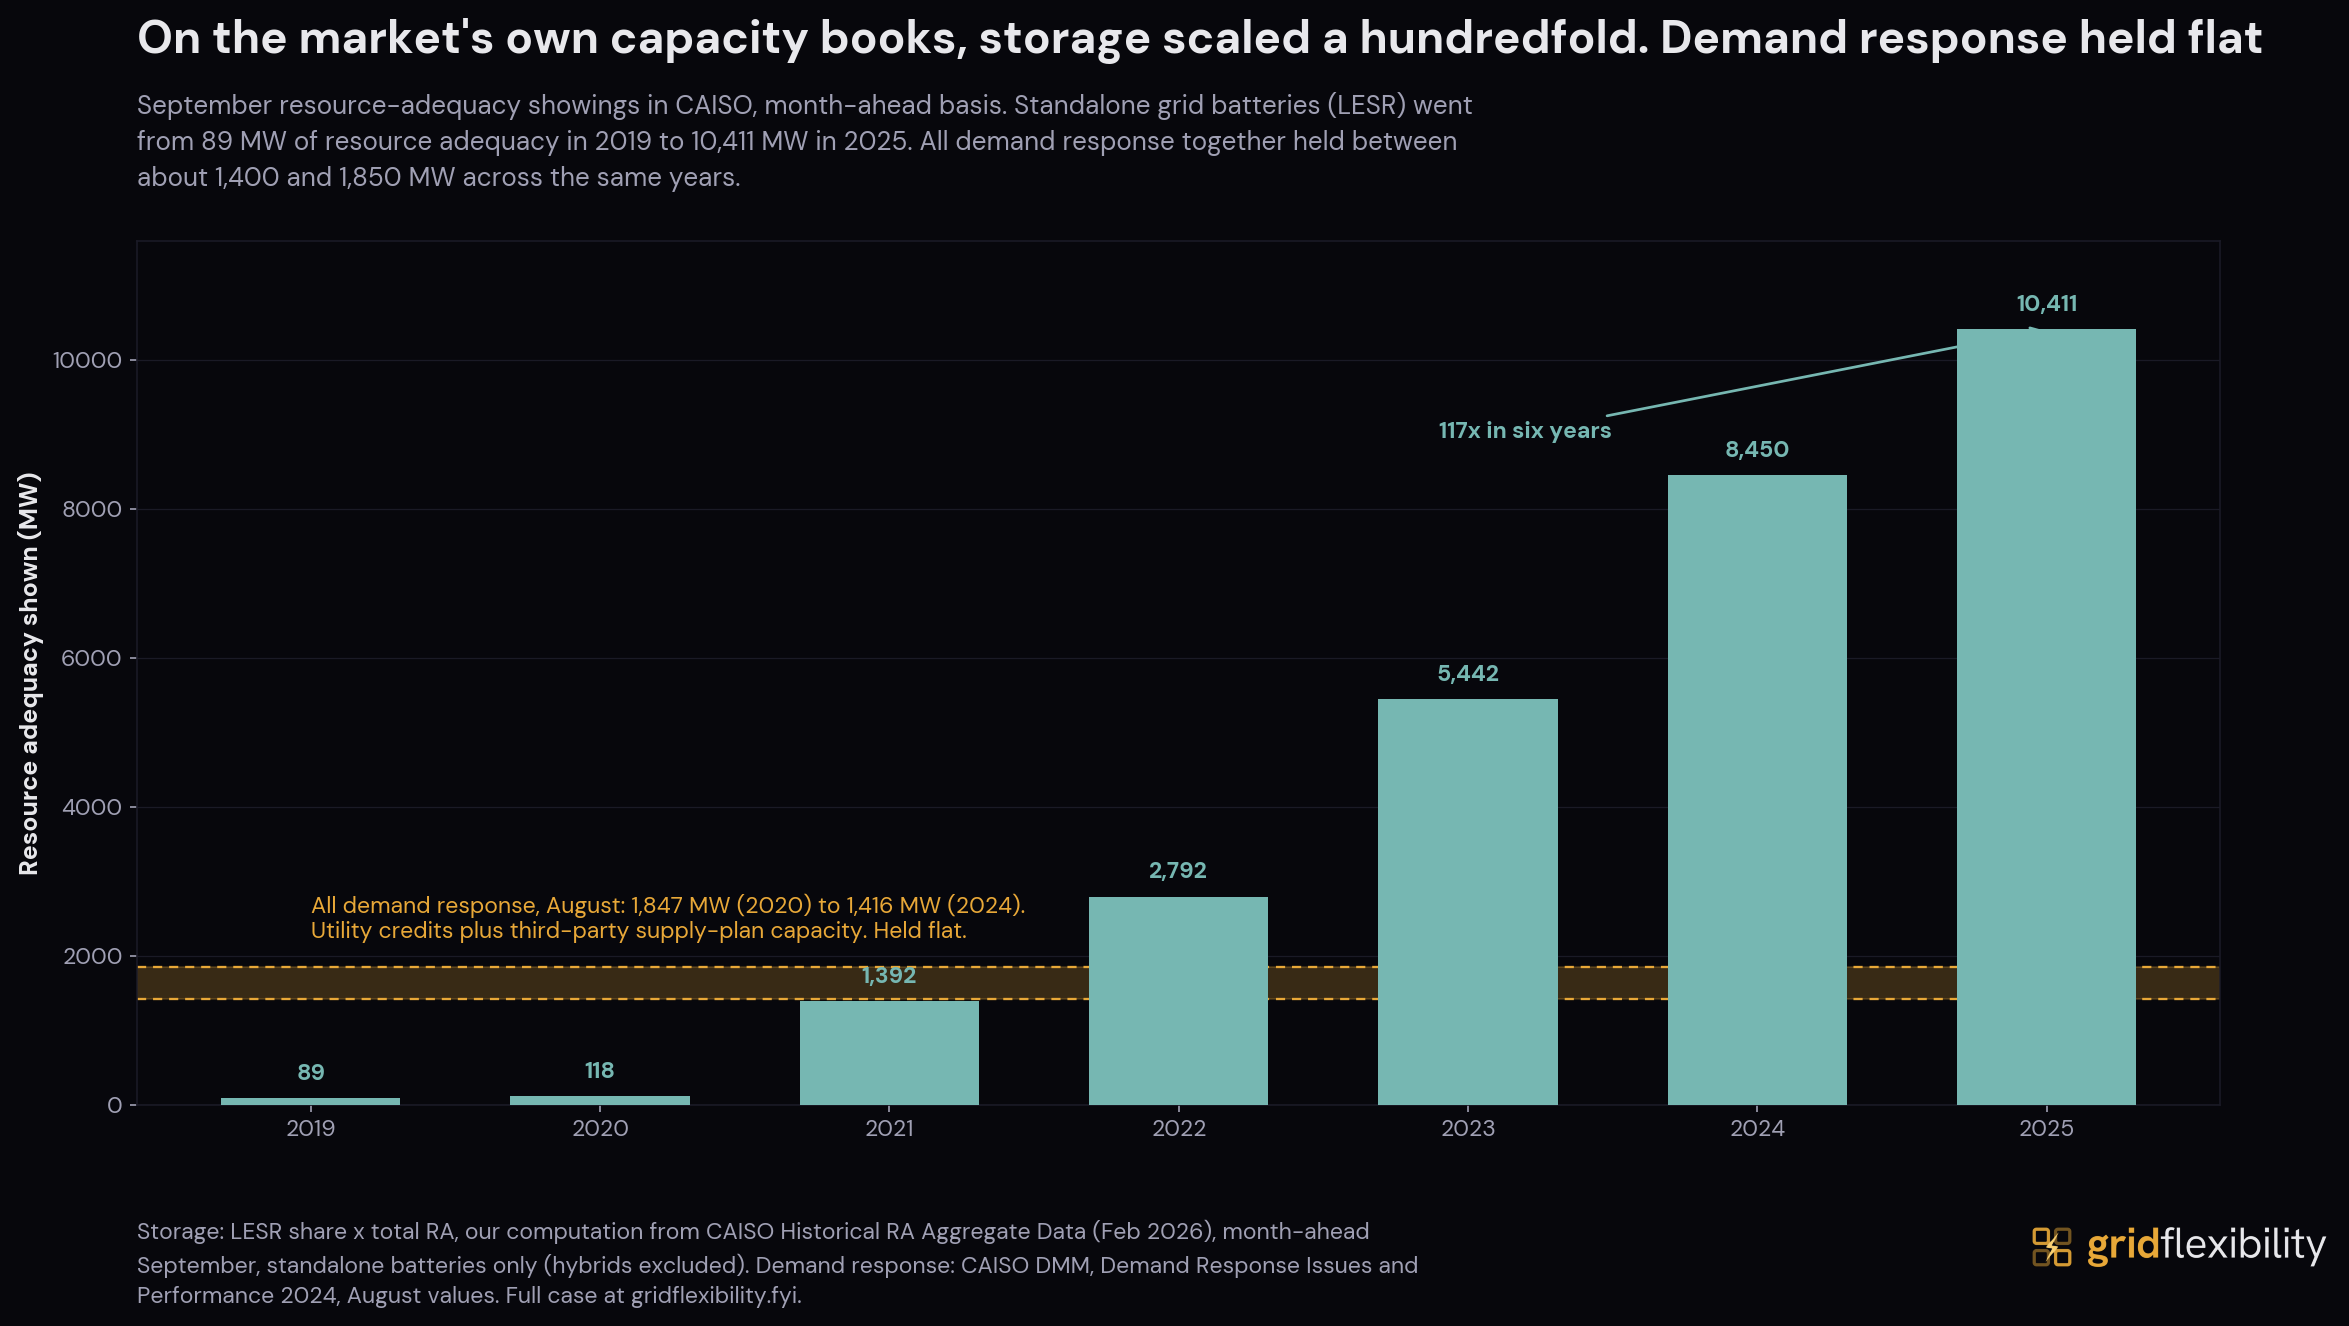
In 2020, California had rolling blackouts and almost no battery storage. By 2025, batteries supply 5.4 GW on a typical evening. The scarcity premium that kept gas peakers viable has fallen to its lowest level in five years. The shift accelerated in 2023, when a gas crisis and structural strain pushed the premium to a peak. Batteries absorbed it.
California's evening peak, decomposed (6-8 PM Pacific)
All three panels measure the same evening window: 6-8 PM Pacific. Lines show the median daily value across the year. Shaded bands show the interquartile range (25th-75th percentile). Evening premium = average real-time price during the evening peak (6-8 PM) minus the overnight baseline (2-4 AM), measuring how much more expensive electricity is during scarcity hours vs low-demand hours. This is a different measure than the price-vs-median scarcity premium in Act II. Dispatch: CAISO Today's Outlook 5-minute fuel mix (CAISO balancing authority). July 2024 heat wave: CAISO market notice. 2022 Flex Alert count: CAISO 2022 Summer Assessment.
Read the three panels together. From 2020 to 2022, the evening premium held steady around $8-12/MWh while gas averaged 11.7 GW of evening dispatch and batteries barely registered. The volume of gas dispatch at evening is the primary driver of the premium: whichever gas plant runs last clears the price for everyone.
In 2023, the premium peaked at $12.5/MWh, with the 75th percentile at $22.3/MWh. Two forces converged: the California gas crisis pushed fuel costs above $20/MMBtu as pipeline constraints tightened supply, and the dispatchable fleet was already straining. Separating the fuel cost effect from the structural shift is not straightforward: both moved together through 2023.
By 2025, the two diverged. California gas prices fell from 2023 crisis levels but remained above the pre-2022 baseline, while the premium kept falling. Battery evening dispatch reached 5.4 GW, gas dropped to 7.3 GW, and the typical evening premium fell to $4.5/MWh. The narrowing bands tell the rest of the story: not just a lower median, but a tighter distribution. Fewer spike days, less room for peakers. Fuel costs explain part of the price level. Battery storage now absorbs evening peaks that gas peakers once served, discharging about 5.4 GW nightly. TOU rates, now the default for 20+ million California residential customers, contribute a complementary but smaller effect (3-5% peak reduction per customer in CPUC pilot evaluations) and importantly widen the price spread that makes battery arbitrage profitable.
The proof point came in July 2024. Nearly two weeks of triple-digit heat across California. In 2022, a shorter heat wave required 10 consecutive Flex Alerts (California's emergency call for voluntary conservation) to avoid blackouts. In 2024, with nearly 10 GW of battery capacity online, CAISO issued zero.
Batteries are not only filling the evening peak. They are absorbing midday surplus. By 2025, the fleet charges at over 5 GW every midday and sustains discharge through midnight, a daily swing of 11 GW from charging to discharging. As solar capacity grew, the charging peak shifted from afternoon to noon while the discharge peak extended from 5 PM to 8 PM. Net Energy Metering 3.0 (NEM 3.0) reinforced this pattern: by cutting rooftop solar export compensation, the policy pushed new residential installations toward battery pairing, adding distributed storage that charges at midday and discharges in the evening.
Beyond California: 2025 YoY wholesale price change by grid
In 2025, wholesale electricity prices rose 5% or more on six of the seven major US grids: New York (NYISO) up 69%, New England (ISO-NE) 67%, Mid-Atlantic (PJM) 50%, Midwest (MISO) 42%, Southwest (SPP) 32%, and Texas (ERCOT) 22%. Multiple factors contributed, including higher natural gas prices, increased demand, and tighter capacity margins. The outlier: California (CAISO), where wholesale prices held roughly flat (+1%). Its 15+ GW of battery storage appears to have absorbed much of the upward pressure. While isolating the battery effect from other variables (weather, hydro, load growth) requires further analysis, the pattern is consistent with the CAISO decomposition above.
Year-over-year change in annual average load-weighted RTM LMP, 2024 vs 2025. Load-weighted using zone-to-load mappings per ISO. SPP uses DAM hub average (no RTM data available). These seven grids represent over 95% of US wholesale electricity volume. Gas price changes vary by region due to pipeline constraints and local supply.
The price signal tells one story. The infrastructure planning process tells another.
Deferred traditional infrastructure (Brooklyn-Queens Demand Management, or BQDM)
A $131M portfolio of demand response, storage, and efficiency deferred about $1 billion in proposed substation, switching station, and feeder infrastructure in Brooklyn and Queens. 61.2 MW of peak demand reduction from the portfolio as of Q3 2023.
About $1B is the cost of the traditional infrastructure proposed in the 2014 PSC order (printed p. 3). Results are those Con Edison reported through Q3 2023. Con Edison's February 2026 plan says the load relief targets were met and project closeout runs through 2026.
BQDM expanded into broader portfolios
Con Edison extended the BQDM approach into its Non-Wires Solutions (NWS) portfolios. Water/Plymouth (~10 MW, $73M+ net benefits, eliminated traditional upgrades). Newtown (>10.1 MW, deferred traditional transfer work). Same methodology, broader application.
Bulk reliability
In Winter Storm Elliott (December 2022), PJM called demand response once it declared an emergency. PJM initially estimated 7,400 MW of load-management reduction. Its later accounting found about 3,500 MW across December 23-24, including 2,400 MW on December 24.
Demand response in three 2022 stress events
California, September 6, 2022. CAISO called 1,267 MW of market demand response at hour ending 18, plus 1,216 MW of non-market resources (CAISO market monitor, p. 39). Those are resources called, not a measure of what was delivered in that hour. Across the high-load days of summer 2022, utility programs reported meeting about 88% of scheduled load reductions. Third-party supply-plan programs averaged about 45% (CAISO market monitor, 2022 demand response report, p. 4).
Texas, July 13, 2022. ERCOT's Emergency Response Service averaged about 914 MW against an obligation of about 834 MW and peaked near 963 MW (ERCOT, slide 4). The market monitor reports up to 1,011 MW deployed (Potomac Economics, p. 35). The fleet underperformed in the first hour. About half of participating portfolios failed ERCOT's event performance test, which requires 95% in both the first full interval and all intervals.
PJM, 2022. In June, load management in one subzone (AEP Marion, about 100 MW committed) recorded 66% to 97% capacity compliance against commitments. In December, capacity compliance ran 119% to 130% of commitments across the whole RTO. Those are compliance percentages, not measured reductions. The measured side is average hourly settled energy reductions: 945 MW on December 23 and 2,158 MW on December 24, against 4,376 MW and 7,323 MW that sellers had expected (PJM Load Management Report 2022/23, Table 4). This is a different measure from the FERC and NERC estimate above, and the two should not be added.
Non-wires alternatives (NWAs): projects that defer traditional infrastructure using distributed resources
Early integrated planning with demand-side management. PG&E's Delta District study projected that planning with demand-side management would reduce local T&D capacity investment in a fast-growing part of far eastern Contra Costa County by about 32 percent over 30 years ($112.3M to $76.4M), a modeled result rather than realized spending. The linked Model Energy Communities pilot set out to work on up to 5,000 existing air-conditioned homes over three years to defer a planned new substation. E4TheFuture dates PG&E's first non-wires alternative to 1991.
One of the largest NWA programs in the US. Con Edison spent $131M on demand response, battery storage, energy efficiency, CHP, and voltage optimization to defer about $1B in proposed substation, switching station, and feeder infrastructure in Brooklyn and Queens. The portfolio had achieved 61.2 MW of peak demand reduction by Q3 2023. Con Edison's February 2026 plan says it met its load relief targets, ended sales of new energy efficiency projects at the end of 2024, and expects projects to keep closing out through 2026.
SCE describes its pilot as a first-of-its-kind attempt to use energy efficiency, demand response, solar, and energy storage to meet localized power needs in a major US metropolitan area. SCE set out to hold 300 MW of load growth (2013-2022) to net zero in the Johanna and Santiago substation area of Orange County (about 250,000 customer accounts), with the goal of deferring or eliminating the need for additional gas-fired generation. Resources acquired by the end of 2015 included 20 MW of energy storage.
BPA decided in May 2017 not to build the I-5 Corridor Reinforcement Project, an 80-mile, 500-kV transmission line that its 2016 Final EIS put at about $750 million for the central route alternative (2015 dollars). BPA ran a pilot from July 2017 to September 2018. The procured portfolio (about 355 MW of generation redispatch and 45 MW of demand response) yielded approximately 100 MW of aggregate relief at the constrained flowgate during summer peak periods. Summer peak flows were lower with the pilot in effect than without it.
As of July 2026, Green Mountain Power says its virtual power plant is 110 MW, with more than 5,000 customers and more than 10,000 batteries in its home battery programs. During the early July 2026 heat event GMP deployed 90 MW of stored energy and reports an estimated $6M saved for customers in one peak hour. GMP says it was the first utility in the country to offer a fully tariffed, state-approved home energy storage lease program. The Vermont PUC records that the programs were initially approved on May 20, 2020.
GridSolar's portfolio of battery and thermal storage, solar, efficiency, and backup generation was designed to defer an $18M transmission rebuild in Boothbay, Maine. The estimated $6M portfolio cost about one-third of the proposed $18M rebuild. GridSolar's January 2016 report to the Maine PUC projected a net cost under 33 percent of a new line and ratepayer savings of about $18.7M over the project's 10-year life through 2025. Forecast load growth did not materialize and the pilot ended in Q2 2018, so the savings figure is a 2016 projection.
Southeast proof point. Duke Energy Florida completed 13.75 MW of battery storage across two sites in 2022 (8.25 MW Micanopy, 5.5 MW Hamilton). Duke describes Hamilton as an alternative to installing new, more costly distribution equipment and Micanopy as a solution for local power quality and reliability. Demonstrates NWA viability outside restructured markets. Only Hamilton (5.5 MW) is described as the distribution-equipment alternative; the 13.75 MW total also includes Micanopy.
BQDM works. Emergency dispatch works. In five years, California went from rolling blackouts to absorbing two-week heat waves without a single Flex Alert. And yet nationally, only 6.5% of peak capacity is enrolled in demand response. Thousands of megawatts of residential batteries and smart devices sit behind the meter, responding to local rate signals but invisible to the grid operator. The hardware is deploying. The orchestration layer is not.
Act IV
The infrastructure is deployed. The activation layer is not.
The US has deployed the metering infrastructure for a flexible grid. 87% of meters are advanced metering infrastructure (AMI). But a smart meter alone does not create a price signal: that requires rate design changes, billing system upgrades, and customer enrollment. Industrial customers lead at 18.1% on dynamic pricing, commercial at 14.8%, but residential lags at 12.8% (enrollment in time-varying pricing programs, time-of-use included). The metering hardware is in place. The tariff structures, aggregation platforms, and market rules to fully activate it are still in early stages.
The activation gap: percentage points between smart meter deployment and wholesale demand response enrollment
87% of US meters are AMI-capable. But metering is just the foundation. Two layers sit above it: dynamic pricing (tariffs that change what you pay based on when you use electricity) and demand response (programs that pay customers or aggregators to reduce load during peak periods). Industrial customers lead dynamic pricing adoption at 18.1%, commercial at 14.8%, but residential lags at 12.8% (enrollment in time-varying pricing programs, time-of-use included). Only 6.5% of US peak demand (33 GW of ~515 GW) participates in wholesale demand response. The gap between deployed meters and activated flexibility defines the opportunity.
Three concentric gaps
148M AMI meters across all sectors (residential, commercial, industrial). Latest data: 2025 (EIA-861). The 2007 and 2009 points are FERC survey results (utility responses); the series from 2012 is EIA Form 861, a different basis, so the two are not one line. EPAct 2005 (Section 1252) set the regulatory groundwork by requiring utilities to offer time-based rates and consider smart metering. The 2009 ARRA stimulus accelerated deployment ($4.5B for smart grid, deploying ~16M meters through the SGIG program by 2015).
The metering infrastructure is largely in place. The question is what utilities and regulators do with it. A smart meter records when you use electricity. A dynamic tariff changes what you pay based on when you use it. The gap between the two is where most of the unrealized value sits.
18,422,966
Residential, enrolled in time-varying pricing programs (time-of-use included)
Residential: 18.4M customers (12.8%) enrolled in time-varying pricing programs, time-of-use included. EIA-861 reports one enrollment total per utility per class, plus which program types it offers. Note: TOU with fixed schedules can create secondary peaks at higher adoption levels as loads cluster at off-peak start times (NREL 2022). Active managed dispatch is more effective than static time-of-use schedules at scale. Commercial: 2.8M (14.8%). Industrial: 201K (18.1%). Reported figures may understate actual adoption: at least one major California utility reclassified default TOU customers out of dynamic pricing reporting after TOU became the standard rate (reported 2.3M TOU in 2021, then 68K by 2023, while neighboring utilities showed continued growth over the same period). Source: EIA-861 Dynamic Pricing table (2025). 427 utilities report across all 5 pricing types (TOU, real-time, variable peak, critical peak, critical peak rebate).
The tariff gap, crystallized
6M
smart meters deployed by Florida Power & Light
0
reported in EIA dynamic pricing enrollment
FPL: 99.3% AMI, $4.0B T&D in 2024. Residential bills rose ~40% from 2020 to 2025. FPL operates one of the largest direct load control programs in the US (~700K+ participants, utility cycles AC compressors during peaks). But this is supply-side control, not price-signal-based. An opt-in TOU rate exists (9 vs 26 cents/kWh) but adoption is negligible. FPL ran a dynamic pricing pilot in 2011 (120 customers, DOE-funded) and did not scale it.
What happens when defaults change
2.7M
SCE residential customers on TOU (2024)
up from 20K in 2013
California's CPUC mandated default TOU for IOUs starting 2019. SCE spent $3.5B on T&D in 2024 ($927/customer) and has 2.7M on TOU. Same metering technology as FPL. Different regulatory default.
Dynamic pricing and wholesale DR are different mechanisms
Dynamic pricing (Gap 2) is a retail tariff: the rate on your bill changes with time of day (TOU), wholesale market conditions (real-time pricing), or grid stress events (critical peak pricing). You respond by shifting when you use electricity. It requires interval metering (smart meters) and rate design approval from state regulators. Wholesale DR (Gap 3) is a market program: an aggregator or curtailment service provider enrolls your load as a dispatchable resource and bids it into the ISO market. You get paid to reduce demand when the grid operator calls on you.
Large industrial loads often participate in wholesale markets through curtailment service providers using SCADA or revenue-grade metering, not retail smart meters. ~26 GW of utility-scale batteries (end of 2024, growing rapidly) participate directly as generation resources, not through DR programs. Together with ~25-30 GW of C&I wholesale DR, approximately 50-55 GW of front-of-meter and large behind-the-meter assets are already market-integrated. The 6.5% wholesale DR figure measures demand-side enrollment only. Dynamic pricing changes the price signal. Wholesale DR changes who can participate in the market. Neither requires the other, but they compound.
The 33 GW enrolled in wholesale DR (6.5% of ~515 GW US peak) is overwhelmingly commercial and industrial: large manufacturing loads, data centers, and commercial building management systems that can curtail on demand through curtailment service providers. Separately, ~9,800 MW of residential DR capacity exists through utility retail programs (AC cycling, smart thermostat setbacks), but this is almost entirely utility-administered, not market-facing (FERC 2025 Assessment, Table 4-1). Residential participation in wholesale markets is negligible today. FERC Order 2222 was designed to change this, but implementation has been slow (13 states still opt out of third-party aggregation in MISO territory alone).
FERC Order 2222 (Sep 2020) changes this by requiring ISOs to let distributed energy resources (rooftop solar, home batteries, smart thermostats, EV chargers) aggregate into 100 kW+ bundles and participate in wholesale energy, capacity, and ancillary services markets. Implementation is years behind the original July 2021 compliance deadline. ISOs must build new telemetry systems for aggregation visibility, resolve distribution-wholesale coordination (who has operational control when an ISO dispatches a DER on a distribution utility's system), prevent double-counting between retail and wholesale compensation, and upgrade market software platforms. Progress has been slower than the rule's timeline anticipated:
FERC Order 2222 implementation by ISO
What CAISO operational means: Since Nov 2024, a third-party aggregator (not the utility) can enroll residential batteries, smart thermostats, and solar+storage systems into a Heterogeneous DER Aggregation (HDERA). The aggregation bids into CAISO day-ahead and real-time markets like any other resource. Individual homeowners cannot participate directly; they sign up through an aggregator (e.g., Sunrun, Tesla, Renew Home). The 100 kW minimum means ~30-50 homes per aggregation. Source: FERC Order 2222. ERCOT is not subject to FERC jurisdiction but is running its own ADER pilot (Phase 3: 160 MW cap, approved Jun 2025) with similar goals. Looking ahead, CAISO's Extended Day-Ahead Market (EDAM), launching May 2026 with PacifiCorp, will extend organized day-ahead market access to balancing authorities across much of the Western Interconnection (~11% of US peak demand initially, in addition to CAISO's existing footprint). EDAM is a voluntary market overlay, not an RTO: participating BAs retain their autonomy and are not directly subject to FERC Order 2222 compliance. DER aggregation rules for non-CAISO EDAM participants are still evolving.
A note on what the data can and cannot see
The figures above come from EIA Form 861, which requires utilities to report customers enrolled in dynamic pricing programs. In deregulated markets (Texas, Pennsylvania, Ohio, Illinois, New York, and others), most customers buy electricity from competitive retailers, not regulated utilities. These retailers file EIA-861 sales data but are not required to classify their rate structures as “dynamic pricing.” Of 253 retail power marketers filing EIA-861, only 7 report any dynamic pricing customers.
This creates a structural blind spot. In Texas alone, major retailers offer time-of-use products (free nights, solar buyback, event-based credits) to millions of customers that are invisible to federal reporting. Large commercial and industrial customers in deregulated states frequently negotiate indexed or real-time rates with competitive suppliers, also unreported. The 16.5 million residential customers served by competitive retailers nationally (RESA, 2024) are largely absent from the dynamic pricing dataset.
Source: EIA-861 Form Instructions (Schedule 4B has no cross-reference to Schedule 6C). RESA 2024 Energy Trend Report (16.5M competitive retail customers). EIA-861 Instructions | RESA 2024 Report
The cost landscape: where flexibility fits
US investor-owned utilities spent $87B on transmission and distribution in 2024, up from $28B in 2010. This infrastructure is essential, but a meaningful share of distribution spending is driven by peak demand. Flexibility resources can defer some of these investments at lower cost.
FERC Form 1 Schedule 204, compiled via PUDL / Catalyst Cooperative. Covers 218 FERC-jurisdictional IOUs. Does not include municipal utilities or cooperatives (~20-30% additional).
Flexible capacity against supply-side capacity
Modeled net cost for an example utility to obtain 400 MW of peaking capacity, per kW-year (Brattle, 2023, reproduced in the Department of Energy's 2025 virtual power plant update):
$43
Virtual power plant
$69
Utility-scale battery
$99
Gas peaker
Each figure is net of the energy and ancillary-service value the resource provides, so it sits below the levelized battery cost shown below. The virtual power plant is smart thermostats, smart water heating, home EV managed charging, and behind-the-meter batteries. FERC's 2023 assessment repeats Brattle's finding that a virtual power plant can provide the same resource adequacy at 40% to 60% of the cost of a gas peaker or a utility-scale battery.
A newer Brattle study for PJM (2025) estimates the net cost of a new gas combustion turbine at $195 per kW-year and a four-hour battery at $230, counted per kW of accredited capacity in 2028 dollars and net of expected energy-market revenue (on installed kW, $154 and $149). It assumes merchant-developer financing for PJM's capacity auction, which makes it a different basis from the figures above. It does not price virtual power plants.
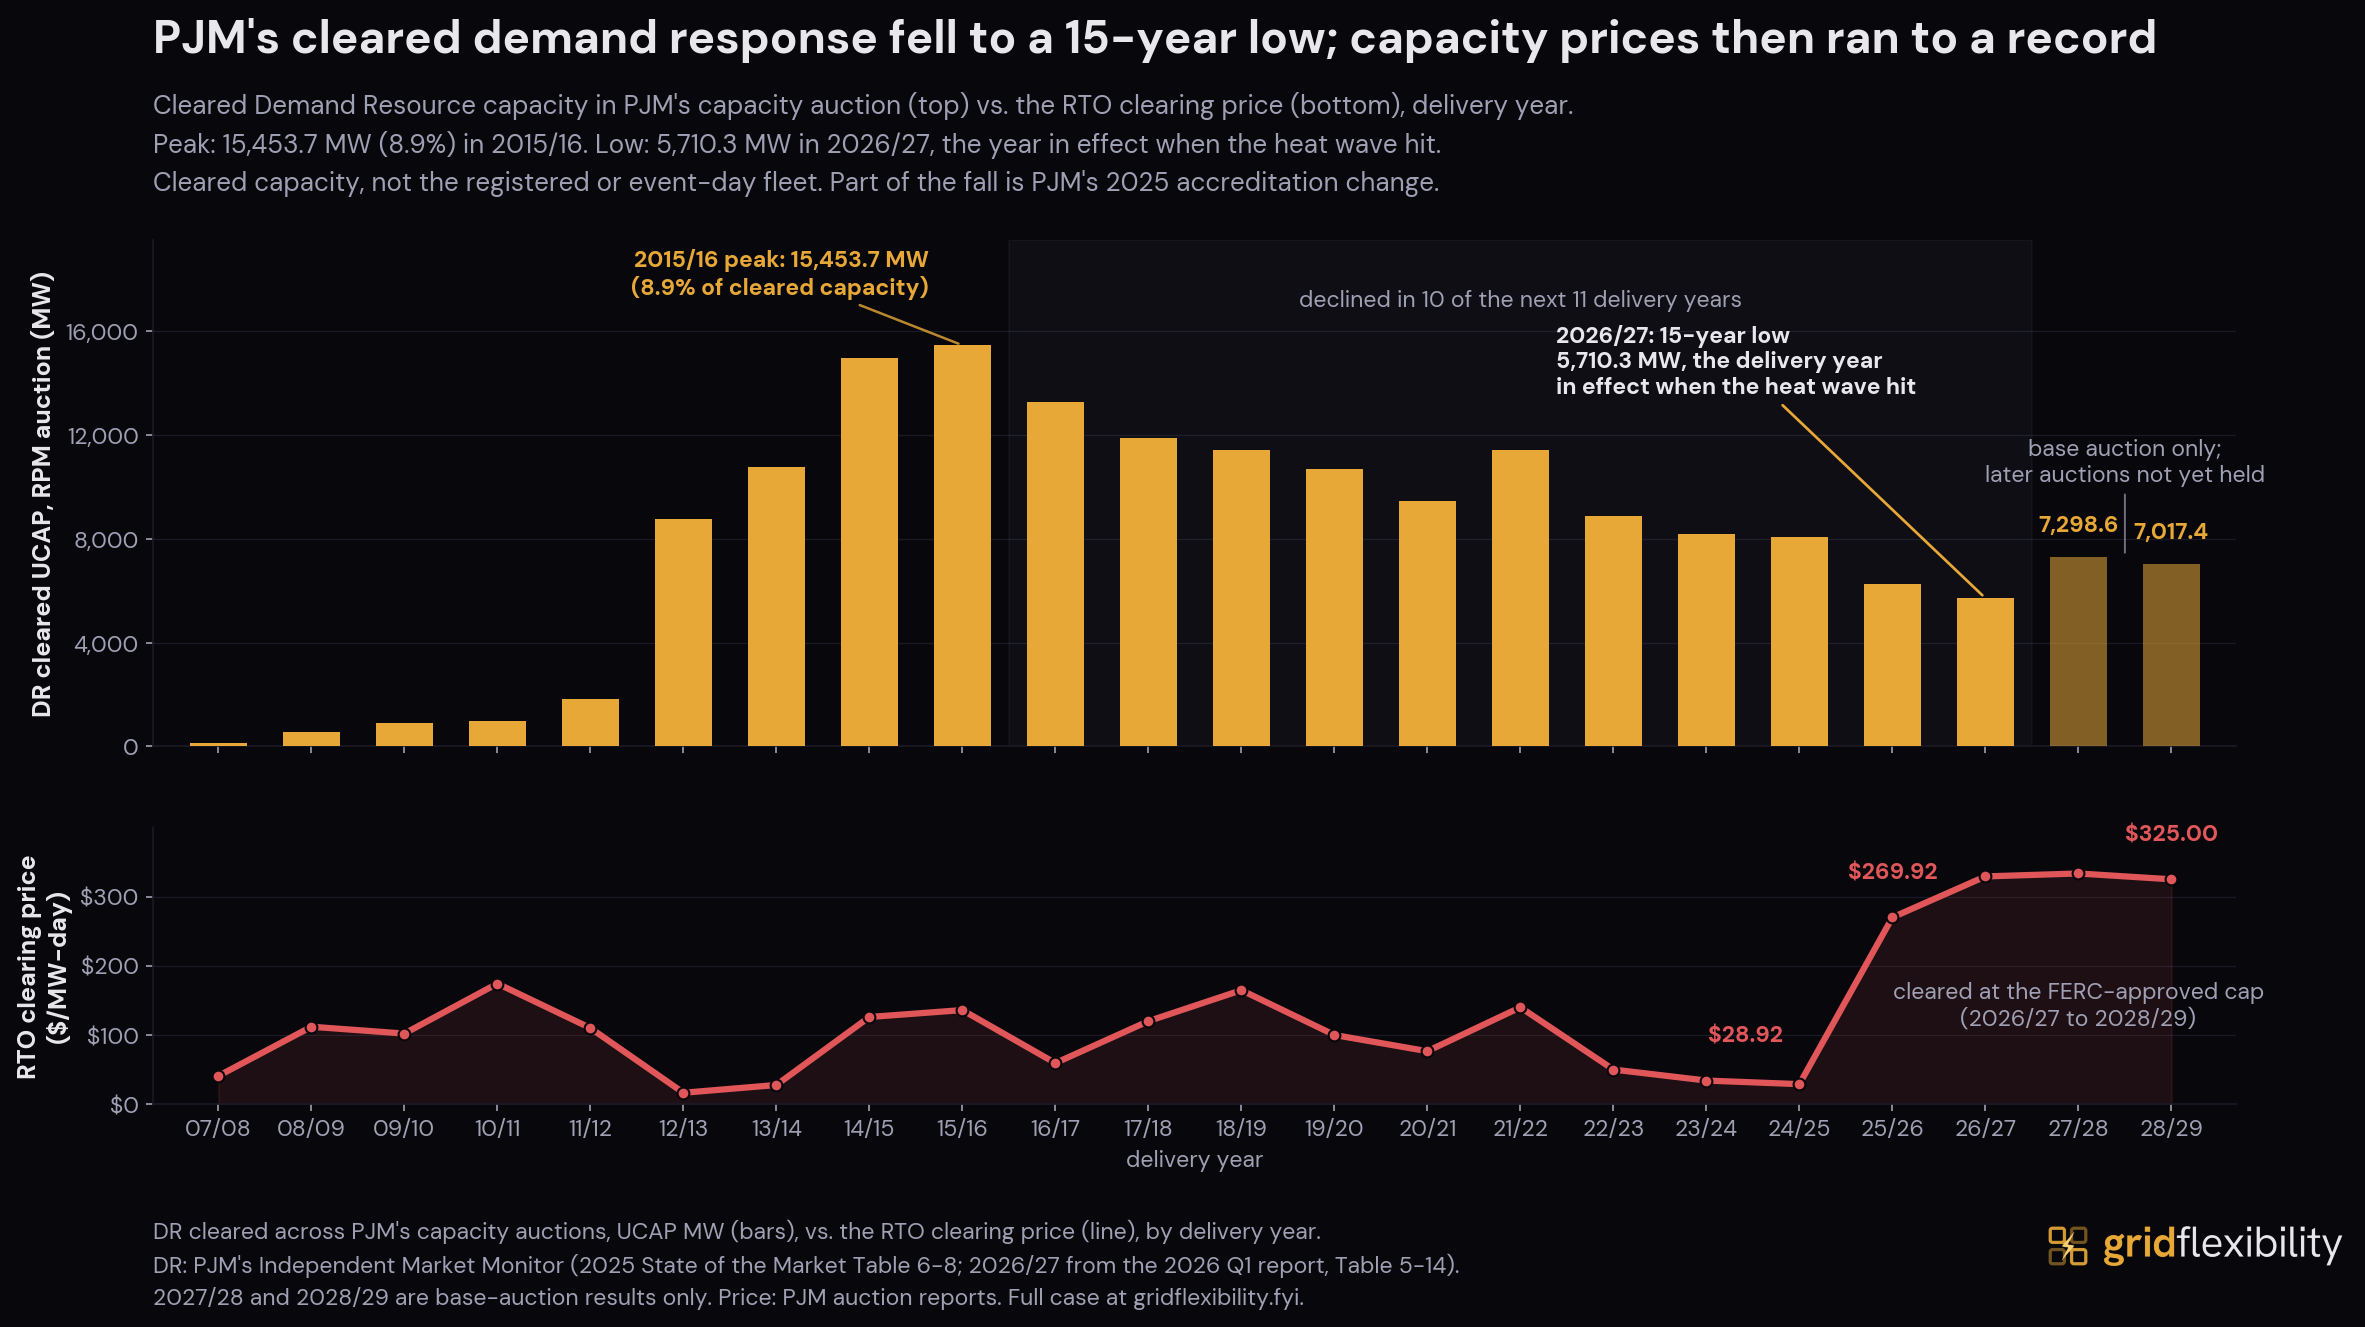
PJM's last three capacity auctions cleared at $329.17, $333.44, and $325.00 per MW-day (about $120, $122, and $119 per kW-year of accredited capacity) for 2026/27, 2027/28, and 2028/29. In the 2028/29 auction, 7,017.4 MW of accredited demand response cleared. An auction price is what every cleared resource is paid, whatever its own cost.
For the 32 utilities that report both 2024 demand response spending and achieved peak reduction in ACEEE's February 2026 review, the median is $80.68 per achieved kW-year (our calculation from ACEEE's Table C3). ACEEE's modeled gas peaking cost is $51.72 to $85.63 per effective kW-year, which adds capital and fixed operating cost and scales it for an 87% accreditation. The ten lowest reported demand response costs run $6.62 to $53.43, and the highest is $3,799.83. The two figures use different accounting, so they do not establish equivalent reliability service.
Avoided T&D in constrained areas
$47-181/kW-yr distribution capacity
Long-term, capacity-constrained areas (CPUC 2024 ACC)
Battery storage (utility-scale, 4-hour)
$145-$319/kW-yr levelized cost
US utilities spent $87B on transmission and distribution infrastructure in 2024 ($56B distribution, $32B transmission), growing 8.6% annually since 2010. Most of this serves maintenance, reliability, new connections, and grid modernization. Flexibility does not compete with all of it. It competes with the subset of projects driven by peak demand growth in capacity-constrained areas. For EV charging specifically, active managed charging can defer distribution upgrades by up to 10 years in EV adoption hotspots, reducing distribution grid costs by up to $230 per EV annually relative to passive time-of-use charging (Brattle Group, January 2026, pp. 7-8).In capacity-constrained areas more broadly, the marginal cost of new distribution capacity ranges from $47 to $181/kW-yr for long-term distribution capacity (CPUC 2024 Avoided Cost Calculator, varying by utility and climate zone). Battery storage ($145-319/kW-yr) is more expensive than most T&D alternatives but provides additional value through energy arbitrage, frequency response, and duration that T&D infrastructure does not.
Delivered demand response can fall short of what operators expect. In Winter Storm Elliott (December 2022), PJM initially estimated 7,400 MW of load-management reduction. Its later accounting found about 3,500 MW across December 23-24, including 2,400 MW on December 24 (FERC-NERC staff report, p. 71). In June 2022, PJM's load management events in the AEP Marion subzone (about 100 MW committed) recorded 66% to 97% capacity compliance against commitments, a compliance percentage and not a measured reduction (PJM Load Management Report 2022/23, Table 4). For batteries, CAISO's market monitor found that scheduled output during the September 2022 heat wave was at most 82% of available capacity on average (CAISO DMM, p. 28).
Where dynamic pricing adoption leads
Norway
of household consumption
on hourly spot-price contracts (SSB)
Sweden
of household contracts
on market-linked rates (ACER 2024)
Spain
of residential customers
on PVPC default TOU (CNMC)
US
of residential customers
on any time-differentiated rate (EIA)
These markets differ from the US in size, grid structure, and regulatory history. Norway (5.4M people) and Sweden (10.4M) are far smaller, with hydro-dominated supply and 30+ years of deregulated retail markets. Direct comparison to the US grid is imperfect. But the pattern is instructive: every market that achieved high adoption combined smart meter deployment with regulatory defaults that make time-differentiated pricing opt-out rather than opt-in. Norway deregulated in 1991. Spain made its PVPC tariff the default in 2013, enrolling ~40% of residential consumers. Where US states have changed the default (California TOU mandates), adoption has followed. The opportunity is in tariff design and market access, areas where the US has significant room to grow.
The metering infrastructure is deployed. Smart thermostats, home batteries, and EV chargers are in millions of buildings. The devices that could respond to grid signals already exist. What is missing is the activation layer: the tariff structures that send price signals, the aggregation platforms that bundle distributed resources, and the market rules that let them compete. FERC Order 2222 opened the door. Only CAISO has walked through it. The gap between what is deployed and what is activated is where the next wave of grid value will come from.
Act V
Which markets are ready for flexibility, and what's in the way?
Flexibility value exists in every major US electricity market. The path to capturing it varies.
The constraint differs in every market. In some, the infrastructure is deployed but dormant. In others, the market works but the value is shifting. This comparison shows the system need, the activation path, the value at stake, who holds the decision rights, and whether the opportunity is durable across all seven major US ISOs.
Validated pathways and mature markets. Seven ISOs ranked using consistent RTM methodology.
Methodology v1.0-2026-03-24. Generated 2026-10-02. Scarcity concentration and TB4 from load-weighted RTM LMP. VPP backtest: 4-stream (energy, capacity, AS, transmission avoidance). Storage: EIA-860M. DR: EIA-861 + FERC 2025 Assessment. Decision rights and market states reflect regulatory structure as of data date.
The two largest demand response programs (MISO and PJM, with a combined 10 GW enrolled) deliver at 35-38% DR utilization when called. Texas has 97% smart meter coverage but price signals reach fewer than 1% of customers through formal channels. New England and New York have the highest wholesale prices. New England still has among the lowest smart meter deployment, locking residential customers out of the opportunity; New York's coverage jumped to about 74% in 2024 after a deployment surge. California has the most complete activation pathway of any market, and its challenge has already shifted from responding to scarcity to managing solar oversupply.
Each market has a different constraint and a different path forward. The map below shows where retirement pressure and transmission constraints concentrate geographically.
Go deeper