Figure
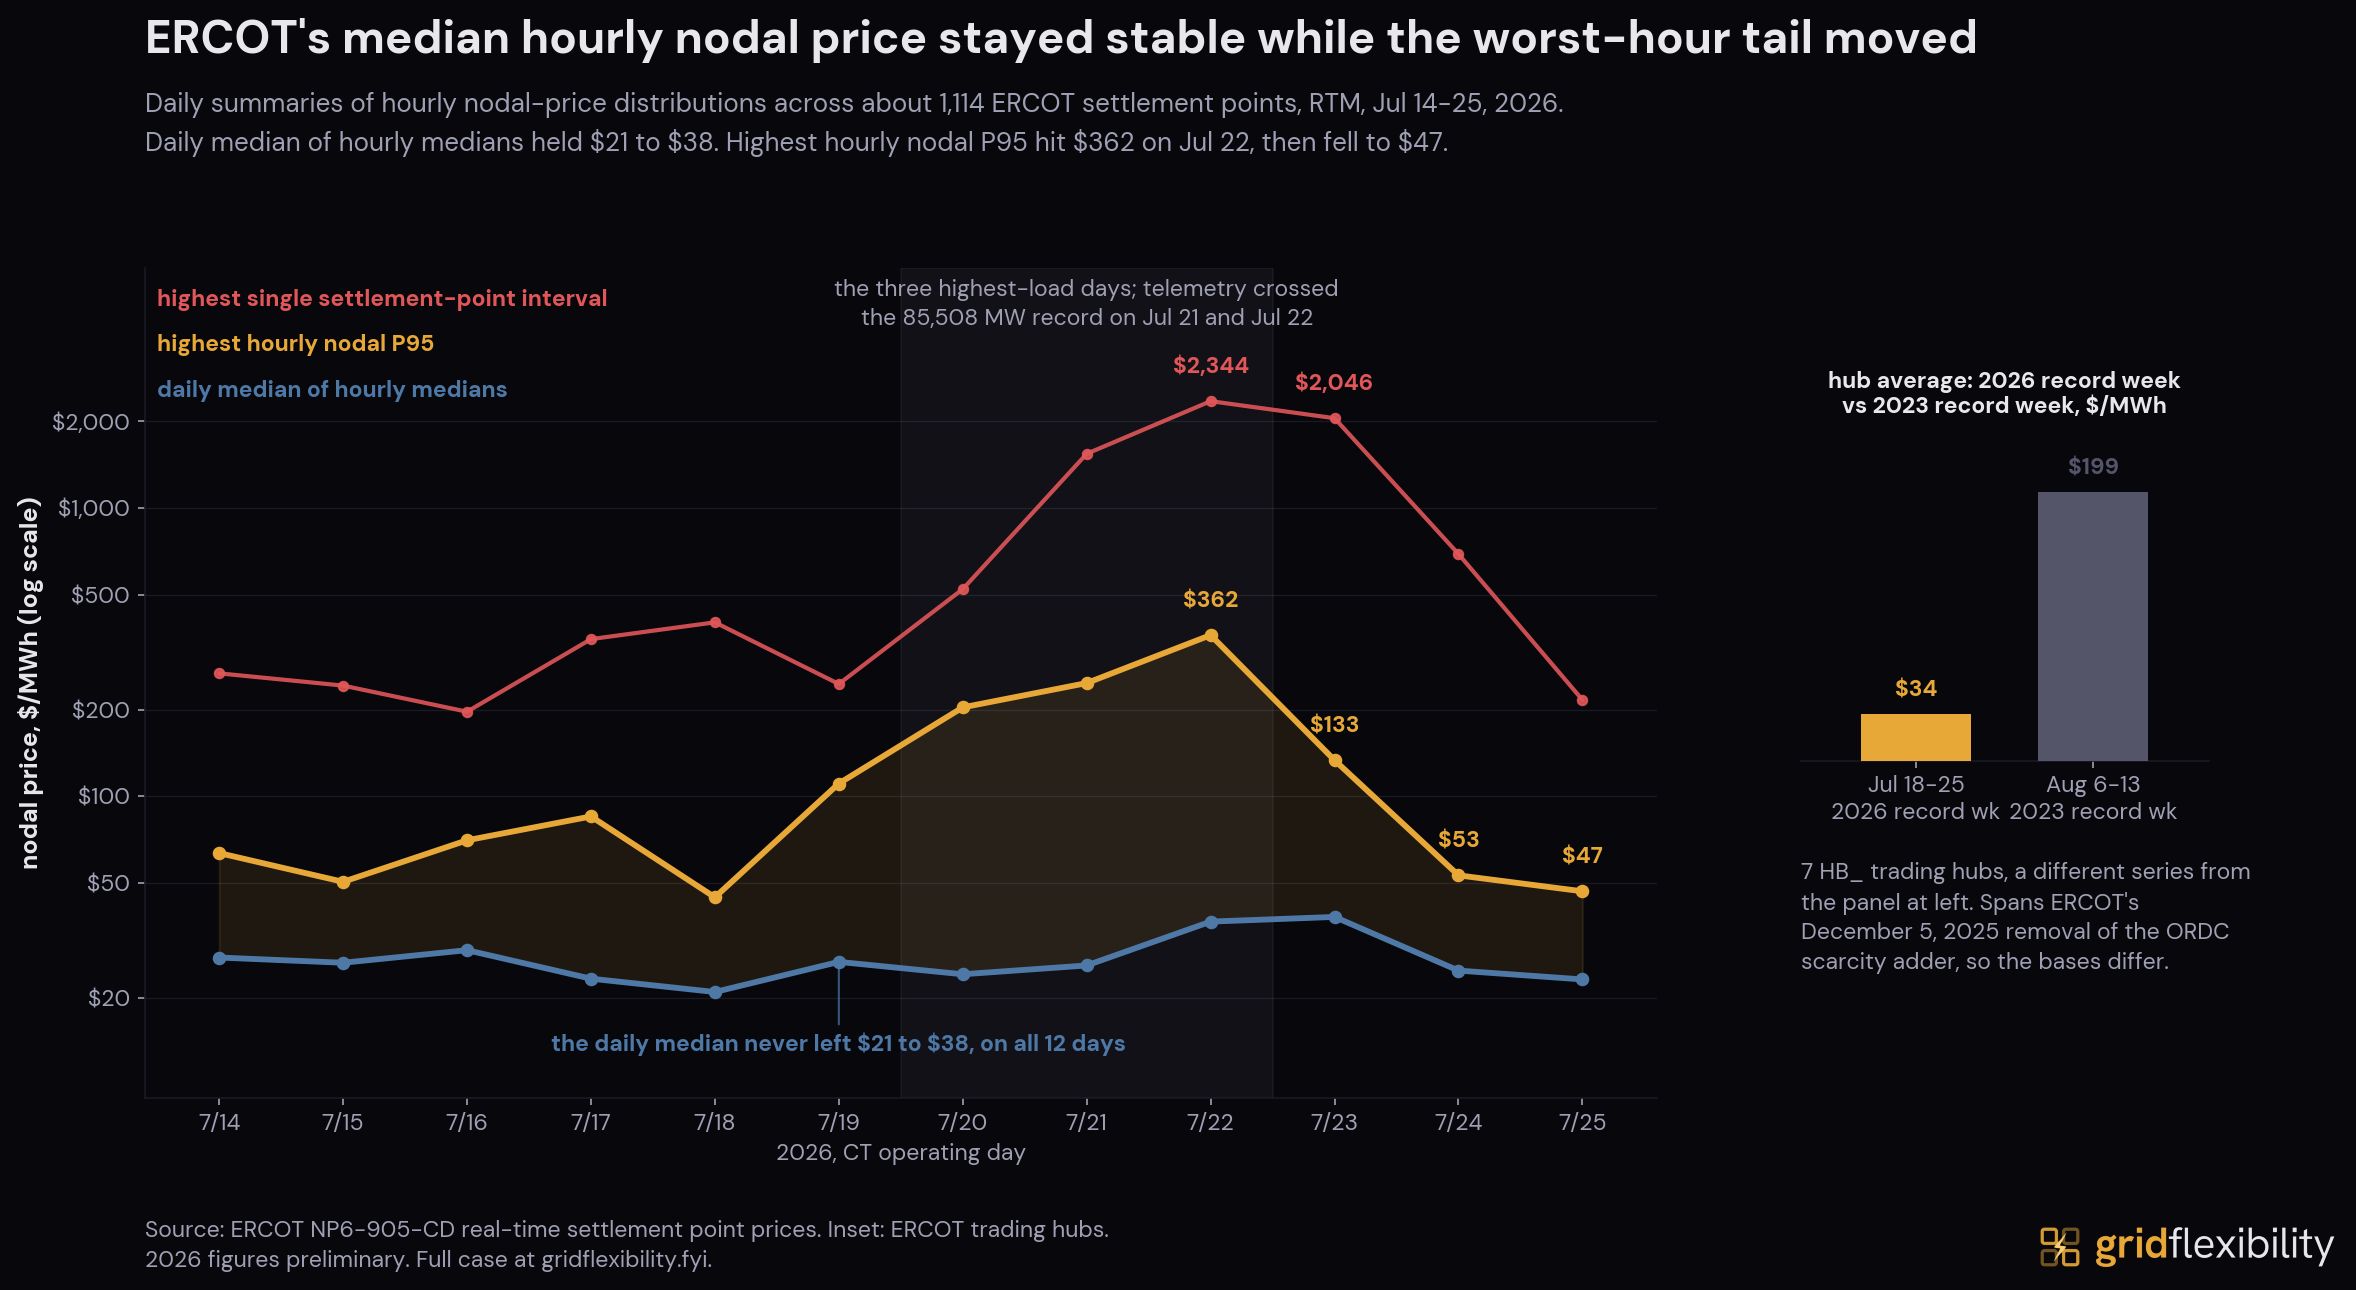
ERCOT's daily median of hourly medians held a $21 to $38/MWh band every day of the record week; only the worst-hour tail moved, and it fell back within three days.
This figure is from the ERCOT July 2026 heat-wave case study, a primary-source reconstruction of an all-time demand record crossed on a week without record heat, and what the public record does and does not show about it.
Cite this figure
Corey Balgeman, "ERCOT daily summaries of hourly nodal-price distributions, July 14 to 25, 2026," Grid Flexibility, 2026. https://gridflexibility.fyi/case-studies/ercot-heat-wave-july-2026/figures/ercot-price-collapse
Licensed CC BY 4.0: free to republish with attribution. License details.
New analyses are announced by email.
Last updated: 2026-08-05.